|
Download Data (XLS File) |
|
||||||||
|
||||||||
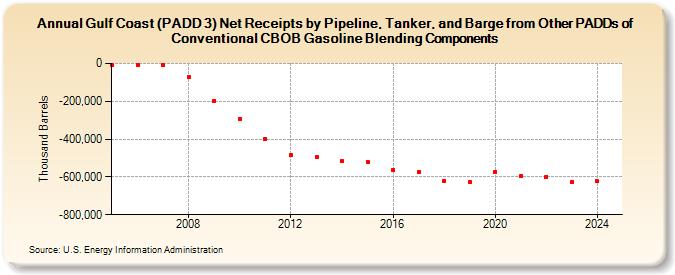
| Gulf Coast (PADD 3) Net Receipts by Pipeline, Tanker, and Barge from Other PADDs of Conventional CBOB Gasoline Blending Components (Thousand Barrels) | ||||||||
| Decade | Year-0 | Year-1 | Year-2 | Year-3 | Year-4 | Year-5 | Year-6 | Year-7 | Year-8 | Year-9 |
|---|---|---|---|---|---|---|---|---|---|---|
| 2000's | -5,871 | -5,749 | -8,979 | -72,801 | -198,291 | |||||
| 2010's | -292,670 | -399,346 | -483,431 | -494,745 | -517,141 | -520,500 | -561,887 | -573,287 | -619,263 | -625,918 |
| 2020's | -572,254 | -596,886 | -598,766 | -626,348 |
| - = No Data Reported; -- = Not Applicable; NA = Not Available; W = Withheld to avoid disclosure of individual company data. |
| Release Date: 8/30/2024 |
| Next Release Date: 8/29/2025 |
Referring Pages: