|
Download Data (XLS File) |
|
||||||||
|
||||||||
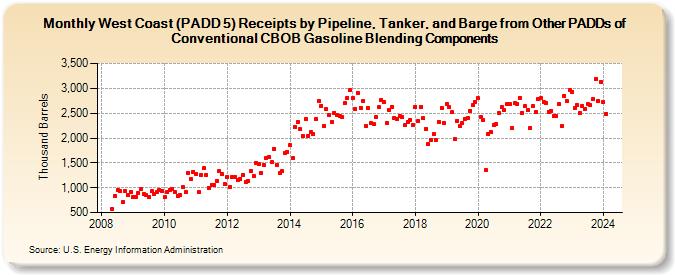
| West Coast (PADD 5) Receipts by Pipeline, Tanker, and Barge from Other PADDs of Conventional CBOB Gasoline Blending Components (Thousand Barrels) | ||||||||
| Year | Jan | Feb | Mar | Apr | May | Jun | Jul | Aug | Sep | Oct | Nov | Dec |
|---|---|---|---|---|---|---|---|---|---|---|---|---|
| 2008 | 571 | 833 | 951 | 937 | 707 | 928 | 855 | 908 | ||||
| 2009 | 822 | 823 | 894 | 969 | 867 | 848 | 814 | 928 | 874 | 904 | 956 | 941 |
| 2010 | 807 | 908 | 961 | 972 | 905 | 843 | 854 | 1,005 | 913 | 1,298 | 1,182 | 1,322 |
| 2011 | 1,281 | 910 | 1,261 | 1,391 | 1,261 | 996 | 1,058 | 1,047 | 1,144 | 1,336 | 1,269 | 1,071 |
| 2012 | 1,216 | 1,017 | 1,220 | 1,223 | 1,161 | 1,183 | 1,258 | 1,115 | 1,137 | 1,333 | 1,239 | 1,501 |
| 2013 | 1,470 | 1,301 | 1,460 | 1,606 | 1,609 | 1,512 | 1,789 | 1,458 | 1,299 | 1,330 | 1,701 | 1,728 |
| 2014 | 1,853 | 1,589 | 2,213 | 2,332 | 2,174 | 2,038 | 2,384 | 2,046 | 2,116 | 2,076 | 2,378 | 2,743 |
| 2015 | 2,651 | 2,248 | 2,581 | 2,468 | 2,324 | 2,510 | 2,465 | 2,444 | 2,425 | 2,703 | 2,815 | 2,961 |
| 2016 | 2,803 | 2,588 | 2,911 | 2,608 | 2,745 | 2,242 | 2,595 | 2,293 | 2,284 | 2,428 | 2,618 | 2,771 |
| 2017 | 2,715 | 2,310 | 2,570 | 2,622 | 2,407 | 2,386 | 2,434 | 2,421 | 2,257 | 2,330 | 2,371 | 2,266 |
| 2018 | 2,628 | 2,335 | 2,626 | 2,402 | 2,187 | 1,870 | 1,967 | 2,080 | 1,959 | 2,327 | 2,613 | 2,305 |
| 2019 | 2,685 | 2,616 | 2,515 | 1,984 | 2,348 | 2,235 | 2,298 | 2,383 | 2,404 | 2,552 | 2,668 | 2,731 |
| 2020 | 2,797 | 2,427 | 2,362 | 1,355 | 2,073 | 2,117 | 2,266 | 2,274 | 2,500 | 2,623 | 2,554 | 2,677 |
| 2021 | 2,677 | 2,201 | 2,697 | 2,685 | 2,815 | 2,504 | 2,639 | 2,563 | 2,209 | 2,639 | 2,517 | 2,795 |
| 2022 | 2,802 | 2,728 | 2,712 | 2,530 | 2,545 | 2,441 | 2,447 | 2,684 | 2,244 | 2,854 | 2,738 | 2,968 |
| 2023 | 2,934 | 2,606 | 2,667 | 2,505 | 2,641 | 2,582 | 2,684 | 2,663 | 2,781 | 3,189 | 2,748 | 3,135 |
| 2024 | 2,725 | |||||||||||
| - = No Data Reported; -- = Not Applicable; NA = Not Available; W = Withheld to avoid disclosure of individual company data. |
| Release Date: 3/29/2024 |
| Next Release Date: 4/30/2024 |
Referring Pages: