|
Download Data (XLS File) |
|
||||||||
|
||||||||
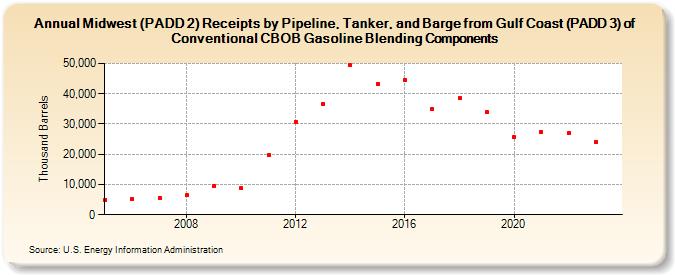
| Midwest (PADD 2) Receipts by Pipeline, Tanker, and Barge from Gulf Coast (PADD 3) of Conventional CBOB Gasoline Blending Components (Thousand Barrels) | ||||||||
| Decade | Year-0 | Year-1 | Year-2 | Year-3 | Year-4 | Year-5 | Year-6 | Year-7 | Year-8 | Year-9 |
|---|---|---|---|---|---|---|---|---|---|---|
| 2000's | 4,951 | 5,269 | 5,564 | 6,415 | 9,597 | |||||
| 2010's | 8,764 | 19,737 | 30,773 | 36,665 | 49,348 | 43,372 | 44,616 | 34,997 | 38,468 | 33,794 |
| 2020's | 25,768 | 27,492 | 26,856 | 23,998 |
| - = No Data Reported; -- = Not Applicable; NA = Not Available; W = Withheld to avoid disclosure of individual company data. |
| Release Date: 3/29/2024 |
| Next Release Date: 8/30/2024 |