|
Download Data (XLS File) |
|
||||||||
|
||||||||
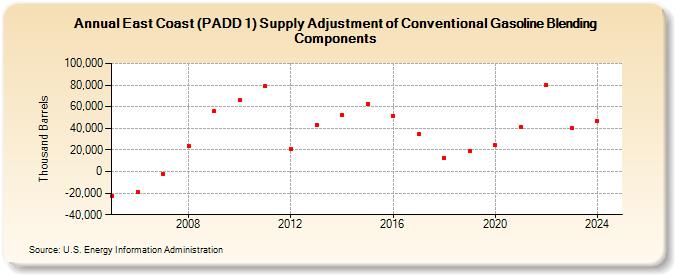
| East Coast (PADD 1) Supply Adjustment of Conventional Gasoline Blending Components (Thousand Barrels) | ||||||||
| Decade | Year-0 | Year-1 | Year-2 | Year-3 | Year-4 | Year-5 | Year-6 | Year-7 | Year-8 | Year-9 |
|---|---|---|---|---|---|---|---|---|---|---|
| 2000's | -22,656 | -18,548 | -1,958 | 23,862 | 55,657 | |||||
| 2010's | 65,854 | 78,813 | 21,212 | 43,501 | 52,332 | 62,741 | 51,793 | 34,271 | 12,691 | 19,359 |
| 2020's | 24,179 | 41,241 | 80,490 | 37,484 |
| - = No Data Reported; -- = Not Applicable; NA = Not Available; W = Withheld to avoid disclosure of individual company data. |
| Release Date: 3/29/2024 |
| Next Release Date: 8/30/2024 |