|
Download Data (XLS File) |
|
||||||||
|
||||||||
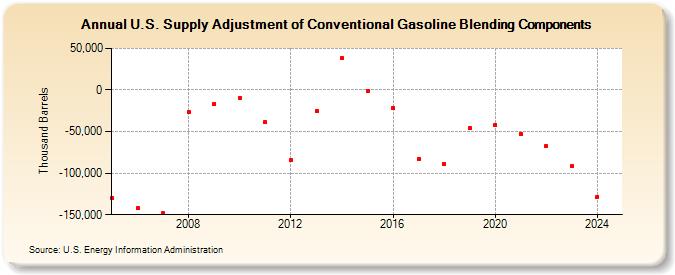
| U.S. Supply Adjustment of Conventional Gasoline Blending Components (Thousand Barrels) | ||||||||
| Decade | Year-0 | Year-1 | Year-2 | Year-3 | Year-4 | Year-5 | Year-6 | Year-7 | Year-8 | Year-9 |
|---|---|---|---|---|---|---|---|---|---|---|
| 2000's | -130,431 | -142,177 | -148,295 | -26,282 | -16,565 | |||||
| 2010's | -9,378 | -38,903 | -84,786 | -25,256 | 38,182 | -1,059 | -21,962 | -82,856 | -88,583 | -45,799 |
| 2020's | -41,834 | -52,759 | -67,715 | -95,925 |
| - = No Data Reported; -- = Not Applicable; NA = Not Available; W = Withheld to avoid disclosure of individual company data. |
| Release Date: 3/29/2024 |
| Next Release Date: 8/30/2024 |