|
Download Data (XLS File) |
|
||||||||
|
||||||||
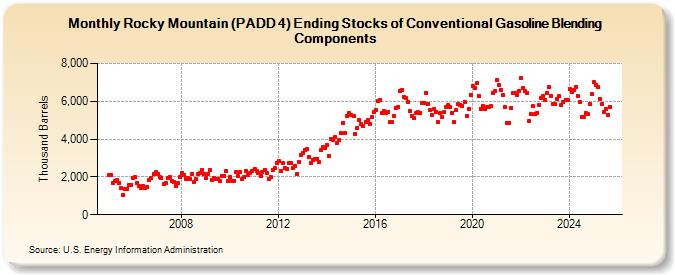
| Rocky Mountain (PADD 4) Ending Stocks of Conventional Gasoline Blending Components (Thousand Barrels) | ||||||||
| Year | Jan | Feb | Mar | Apr | May | Jun | Jul | Aug | Sep | Oct | Nov | Dec |
|---|---|---|---|---|---|---|---|---|---|---|---|---|
| 2005 | 2,114 | 2,110 | 1,684 | 1,794 | 1,810 | 1,694 | 1,417 | 1,053 | 1,349 | 1,359 | 1,593 | 1,580 |
| 2006 | 1,957 | 1,987 | 1,678 | 1,513 | 1,435 | 1,500 | 1,412 | 1,466 | 1,826 | 1,959 | 2,136 | 2,257 |
| 2007 | 2,163 | 2,004 | 1,927 | 1,605 | 1,660 | 1,927 | 2,009 | 1,770 | 1,705 | 1,513 | 1,652 | 1,973 |
| 2008 | 2,228 | 2,108 | 1,915 | 1,950 | 1,909 | 2,163 | 1,748 | 1,877 | 2,175 | 2,186 | 2,374 | 2,168 |
| 2009 | 1,938 | 2,171 | 2,360 | 1,857 | 1,956 | 1,867 | 1,866 | 1,777 | 2,071 | 2,055 | 2,288 | 1,808 |
| 2010 | 1,973 | 1,809 | 1,789 | 2,262 | 2,042 | 2,235 | 1,895 | 1,984 | 2,312 | 2,083 | 2,204 | 2,288 |
| 2011 | 2,423 | 2,332 | 2,183 | 2,059 | 2,239 | 2,380 | 2,197 | 1,900 | 1,993 | 2,372 | 2,468 | 2,747 |
| 2012 | 2,841 | 2,291 | 2,719 | 2,457 | 2,444 | 2,761 | 2,756 | 2,460 | 2,592 | 2,163 | 2,766 | 3,177 |
| 2013 | 3,272 | 3,402 | 3,468 | 3,060 | 2,723 | 2,888 | 2,950 | 2,955 | 2,776 | 3,442 | 3,565 | 3,509 |
| 2014 | 3,695 | 3,083 | 4,005 | 3,962 | 4,113 | 3,803 | 3,929 | 4,298 | 4,876 | 4,332 | 5,221 | 5,355 |
| 2015 | 5,270 | 5,243 | 4,291 | 4,594 | 4,995 | 4,776 | 4,681 | 4,925 | 5,035 | 4,800 | 5,148 | 5,424 |
| 2016 | 5,519 | 5,998 | 6,078 | 5,360 | 5,476 | 5,372 | 5,441 | 4,880 | 4,930 | 5,226 | 5,646 | 5,672 |
| 2017 | 6,535 | 6,603 | 6,249 | 6,166 | 5,968 | 5,479 | 5,234 | 5,109 | 5,397 | 5,411 | 5,375 | 5,897 |
| 2018 | 5,916 | 6,457 | 5,873 | 5,513 | 5,271 | 5,571 | 5,431 | 4,885 | 5,366 | 5,194 | 5,437 | 5,674 |
| 2019 | 5,830 | 5,684 | 5,400 | 4,910 | 5,532 | 5,861 | 5,813 | 5,756 | 5,974 | 5,231 | 5,617 | 6,358 |
| 2020 | 6,816 | 6,704 | 6,947 | 6,269 | 5,587 | 5,740 | 5,582 | 5,693 | 5,713 | 5,734 | 6,435 | 6,519 |
| 2021 | 7,117 | 6,854 | 6,615 | 6,314 | 5,682 | 4,856 | 4,873 | 5,651 | 6,448 | 6,420 | 6,346 | 6,565 |
| 2022 | 7,246 | 6,721 | 6,520 | 6,439 | 4,950 | 5,321 | 5,733 | 5,353 | 5,377 | 5,821 | 6,155 | 6,280 |
| 2023 | 5,827 | 6,171 | 6,465 | 6,293 | 5,852 | 5,721 | 6,107 | 6,282 | 5,830 | 5,948 | 6,090 | 6,032 |
| 2024 | 6,612 | |||||||||||
| - = No Data Reported; -- = Not Applicable; NA = Not Available; W = Withheld to avoid disclosure of individual company data. |
| Release Date: 3/29/2024 |
| Next Release Date: 4/30/2024 |