|
Download Data (XLS File) |
|
||||||||
|
||||||||
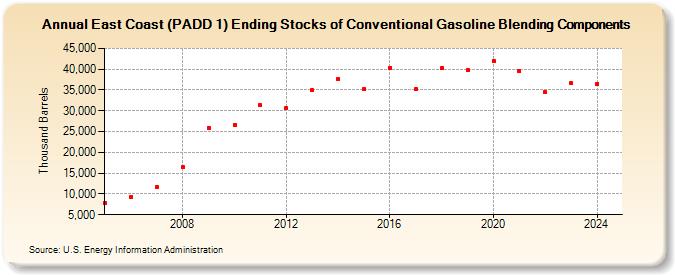
| East Coast (PADD 1) Ending Stocks of Conventional Gasoline Blending Components (Thousand Barrels) | ||||||||
| Decade | Year-0 | Year-1 | Year-2 | Year-3 | Year-4 | Year-5 | Year-6 | Year-7 | Year-8 | Year-9 |
|---|---|---|---|---|---|---|---|---|---|---|
| 2000's | 7,766 | 9,300 | 11,735 | 16,398 | 25,925 | |||||
| 2010's | 26,657 | 31,270 | 30,638 | 34,885 | 37,683 | 35,127 | 40,264 | 35,274 | 40,182 | 39,819 |
| 2020's | 41,991 | 39,531 | 34,407 | 36,693 |
| - = No Data Reported; -- = Not Applicable; NA = Not Available; W = Withheld to avoid disclosure of individual company data. |
| Release Date: 3/29/2024 |
| Next Release Date: 8/30/2024 |