|
Download Data (XLS File) |
|
||||||||
|
||||||||
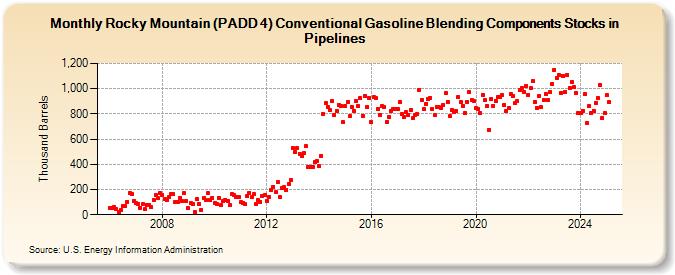
| Rocky Mountain (PADD 4) Conventional Gasoline Blending Components Stocks in Pipelines (Thousand Barrels) | ||||||||
| Year | Jan | Feb | Mar | Apr | May | Jun | Jul | Aug | Sep | Oct | Nov | Dec |
|---|---|---|---|---|---|---|---|---|---|---|---|---|
| 2006 | 54 | 50 | 60 | 45 | 22 | 39 | 70 | 67 | 102 | 174 | 165 | 111 |
| 2007 | 94 | 87 | 55 | 82 | 43 | 81 | 76 | 60 | 120 | 158 | 130 | 175 |
| 2008 | 158 | 123 | 113 | 137 | 164 | 165 | 101 | 104 | 134 | 106 | 174 | 110 |
| 2009 | 53 | 92 | 85 | 22 | 121 | 84 | 37 | 136 | 114 | 170 | 119 | 133 |
| 2010 | 95 | 85 | 135 | 76 | 106 | 118 | 112 | 77 | 165 | 155 | 144 | 140 |
| 2011 | 98 | 93 | 82 | 146 | 174 | 138 | 164 | 82 | 116 | 101 | 151 | 159 |
| 2012 | 111 | 139 | 197 | 222 | 181 | 258 | 140 | 212 | 217 | 198 | 247 | 277 |
| 2013 | 529 | 498 | 526 | 483 | 465 | 490 | 543 | 378 | 381 | 378 | 418 | 423 |
| 2014 | 383 | 465 | 801 | 883 | 857 | 830 | 904 | 794 | 822 | 871 | 863 | 733 |
| 2015 | 861 | 894 | 781 | 855 | 826 | 899 | 859 | 925 | 787 | 942 | 857 | 929 |
| 2016 | 736 | 932 | 927 | 840 | 795 | 861 | 851 | 734 | 778 | 822 | 838 | 837 |
| 2017 | 836 | 893 | 799 | 777 | 812 | 790 | 831 | 766 | 792 | 803 | 990 | 914 |
| 2018 | 840 | 881 | 916 | 930 | 837 | 788 | 856 | 852 | 845 | 874 | 965 | 897 |
| 2019 | 781 | 832 | 813 | 822 | 936 | 891 | 865 | 806 | 895 | 973 | 909 | 906 |
| 2020 | 843 | 842 | 809 | 953 | 908 | 864 | 675 | 919 | 865 | 906 | 932 | 932 |
| 2021 | 949 | 870 | 819 | 845 | 955 | 942 | 885 | 901 | 986 | 1,004 | 975 | 1,025 |
| 2022 | 952 | 1,002 | 1,062 | 897 | 849 | 944 | 853 | 912 | 961 | 909 | 973 | 1,038 |
| 2023 | 1,150 | 1,087 | 1,105 | 969 | 1,102 | 973 | 1,110 | 1,006 | 1,051 | 1,011 | 967 | 806 |
| 2024 | 807 | |||||||||||
| - = No Data Reported; -- = Not Applicable; NA = Not Available; W = Withheld to avoid disclosure of individual company data. |
| Release Date: 3/29/2024 |
| Next Release Date: 4/30/2024 |