|
Download Data (XLS File) |
|
||||||||
|
||||||||
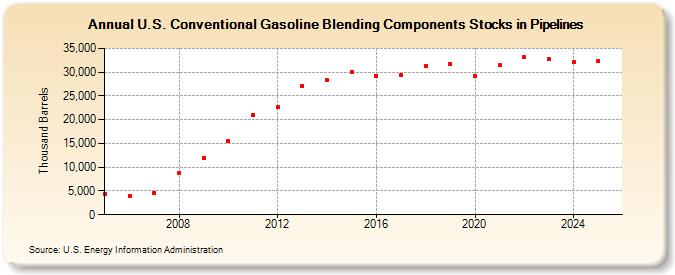
| U.S. Conventional Gasoline Blending Components Stocks in Pipelines (Thousand Barrels) | ||||||||
| Decade | Year-0 | Year-1 | Year-2 | Year-3 | Year-4 | Year-5 | Year-6 | Year-7 | Year-8 | Year-9 |
|---|---|---|---|---|---|---|---|---|---|---|
| 2000's | 4,461 | 4,037 | 4,643 | 8,817 | 11,990 | |||||
| 2010's | 15,448 | 21,011 | 22,682 | 27,042 | 28,244 | 30,112 | 29,169 | 29,307 | 31,379 | 31,711 |
| 2020's | 29,257 | 31,475 | 33,095 | 32,562 |
| - = No Data Reported; -- = Not Applicable; NA = Not Available; W = Withheld to avoid disclosure of individual company data. |
| Release Date: 3/29/2024 |
| Next Release Date: 8/30/2024 |