|
Download Data (XLS File) |
|
||||||||
|
||||||||
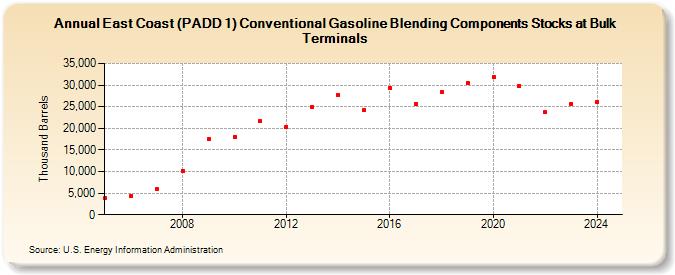
| East Coast (PADD 1) Conventional Gasoline Blending Components Stocks at Bulk Terminals (Thousand Barrels) | ||||||||
| Decade | Year-0 | Year-1 | Year-2 | Year-3 | Year-4 | Year-5 | Year-6 | Year-7 | Year-8 | Year-9 |
|---|---|---|---|---|---|---|---|---|---|---|
| 2000's | 3,766 | 4,373 | 5,871 | 10,132 | 17,504 | |||||
| 2010's | 18,002 | 21,653 | 20,377 | 24,974 | 27,778 | 24,150 | 29,297 | 25,677 | 28,479 | 30,515 |
| 2020's | 31,829 | 29,838 | 23,671 | 25,744 |
| - = No Data Reported; -- = Not Applicable; NA = Not Available; W = Withheld to avoid disclosure of individual company data. |
| Release Date: 6/28/2024 |
| Next Release Date: 8/30/2024 |