|
Download Data (XLS File) |
|
||||||||
|
||||||||
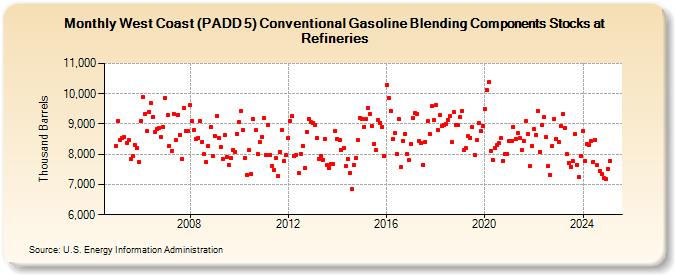
| West Coast (PADD 5) Conventional Gasoline Blending Components Stocks at Refineries (Thousand Barrels) | ||||||||
| Year | Jan | Feb | Mar | Apr | May | Jun | Jul | Aug | Sep | Oct | Nov | Dec |
|---|---|---|---|---|---|---|---|---|---|---|---|---|
| 2005 | 8,268 | 9,106 | 8,486 | 8,551 | 8,571 | 8,376 | 8,475 | 7,834 | 7,940 | 8,315 | 8,212 | 7,755 |
| 2006 | 9,103 | 9,884 | 9,337 | 8,764 | 9,412 | 9,684 | 9,232 | 8,741 | 8,849 | 8,871 | 8,559 | 8,896 |
| 2007 | 9,872 | 9,283 | 8,274 | 8,121 | 9,345 | 8,457 | 9,301 | 8,649 | 7,853 | 9,531 | 8,784 | 8,775 |
| 2008 | 9,613 | 9,114 | 8,802 | 8,487 | 8,542 | 9,096 | 8,416 | 7,996 | 7,747 | 8,274 | 8,904 | 7,945 |
| 2009 | 8,596 | 9,269 | 8,544 | 8,253 | 7,856 | 8,641 | 7,914 | 7,660 | 7,883 | 8,134 | 8,073 | 8,685 |
| 2010 | 9,050 | 9,428 | 8,787 | 7,891 | 7,307 | 8,127 | 7,353 | 9,148 | 8,794 | 8,000 | 8,409 | 8,566 |
| 2011 | 9,192 | 7,990 | 8,953 | 7,987 | 7,626 | 7,494 | 7,863 | 7,289 | 8,075 | 8,799 | 7,786 | 7,959 |
| 2012 | 8,552 | 9,094 | 9,257 | 7,925 | 7,987 | 7,378 | 8,016 | 8,272 | 7,538 | 8,743 | 9,162 | 9,058 |
| 2013 | 9,035 | 8,973 | 8,545 | 7,854 | 7,955 | 7,821 | 8,519 | 7,628 | 7,555 | 7,661 | 7,673 | 8,762 |
| 2014 | 8,514 | 8,462 | 8,143 | 8,204 | 7,612 | 7,858 | 7,378 | 6,854 | 7,638 | 7,864 | 8,461 | 9,207 |
| 2015 | 9,178 | 8,909 | 9,163 | 9,542 | 9,338 | 8,928 | 8,351 | 8,134 | 9,132 | 9,044 | 8,895 | 7,949 |
| 2016 | 10,284 | 9,872 | 9,435 | 8,489 | 8,690 | 8,010 | 9,160 | 7,568 | 8,447 | 8,674 | 8,008 | 7,804 |
| 2017 | 8,341 | 9,208 | 9,364 | 9,332 | 8,429 | 8,357 | 7,659 | 8,413 | 9,088 | 8,677 | 9,580 | 9,127 |
| 2018 | 9,629 | 8,794 | 9,291 | 8,917 | 8,958 | 9,008 | 9,144 | 9,268 | 8,388 | 9,381 | 8,967 | 8,954 |
| 2019 | 9,219 | 9,425 | 8,129 | 8,190 | 8,587 | 8,549 | 8,892 | 7,987 | 8,459 | 9,018 | 8,759 | 8,928 |
| 2020 | 9,494 | 10,115 | 10,378 | 8,123 | 7,822 | 8,206 | 8,308 | 8,357 | 8,533 | 7,779 | 7,998 | 8,013 |
| 2021 | 8,441 | 8,450 | 8,897 | 8,503 | 8,717 | 8,552 | 8,140 | 8,438 | 9,085 | 8,663 | 7,614 | 8,270 |
| 2022 | 8,828 | 8,651 | 9,439 | 8,085 | 8,972 | 9,224 | 8,565 | 7,602 | 7,321 | 8,280 | 9,180 | 8,515 |
| 2023 | 8,419 | 8,928 | 9,314 | 8,880 | 8,007 | 7,714 | 7,593 | 7,780 | 8,669 | 7,652 | 7,261 | 7,953 |
| 2024 | 8,759 | |||||||||||
| - = No Data Reported; -- = Not Applicable; NA = Not Available; W = Withheld to avoid disclosure of individual company data. |
| Release Date: 3/29/2024 |
| Next Release Date: 4/30/2024 |