|
Download Data (XLS File) |
|
||||||||
|
||||||||
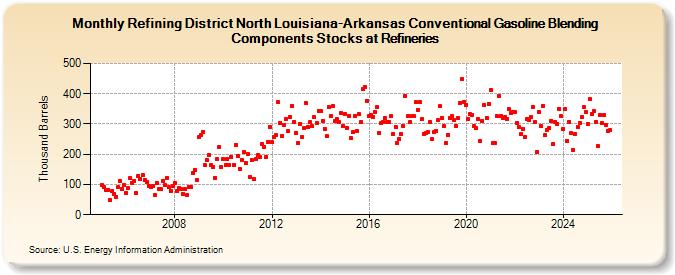
| Refining District North Louisiana-Arkansas Conventional Gasoline Blending Components Stocks at Refineries (Thousand Barrels) | ||||||||
| Year | Jan | Feb | Mar | Apr | May | Jun | Jul | Aug | Sep | Oct | Nov | Dec |
|---|---|---|---|---|---|---|---|---|---|---|---|---|
| 2005 | 98 | 90 | 82 | 83 | 48 | 78 | 69 | 60 | 90 | 113 | 85 | 99 |
| 2006 | 71 | 88 | 120 | 104 | 113 | 71 | 129 | 117 | 131 | 115 | 108 | 94 |
| 2007 | 91 | 95 | 66 | 106 | 84 | 84 | 113 | 97 | 121 | 90 | 79 | 96 |
| 2008 | 106 | 80 | 88 | 85 | 69 | 86 | 65 | 93 | 91 | 137 | 149 | 116 |
| 2009 | 257 | 262 | 275 | 163 | 180 | 198 | 163 | 159 | 123 | 184 | 225 | 158 |
| 2010 | 185 | 163 | 183 | 165 | 190 | 165 | 232 | 193 | 152 | 181 | 207 | 171 |
| 2011 | 201 | 125 | 181 | 118 | 184 | 197 | 192 | 234 | 225 | 191 | 241 | 291 |
| 2012 | 240 | 258 | 263 | 371 | 304 | 261 | 297 | 316 | 276 | 323 | 361 | 307 |
| 2013 | 271 | 238 | 301 | 257 | 288 | 368 | 289 | 305 | 292 | 322 | 304 | 344 |
| 2014 | 344 | 311 | 284 | 259 | 356 | 328 | 358 | 309 | 317 | 305 | 337 | 293 |
| 2015 | 334 | 288 | 328 | 253 | 272 | 327 | 277 | 332 | 307 | 414 | 422 | 377 |
| 2016 | 325 | 329 | 323 | 341 | 355 | 271 | 304 | 307 | 320 | 306 | 306 | 325 |
| 2017 | 268 | 291 | 236 | 250 | 268 | 292 | 394 | 325 | 305 | 325 | 327 | 372 |
| 2018 | 347 | 371 | 315 | 268 | 269 | 274 | 305 | 249 | 272 | 276 | 312 | 358 |
| 2019 | 319 | 292 | 236 | 264 | 320 | 326 | 313 | 292 | 319 | 368 | 448 | 374 |
| 2020 | 364 | 315 | 332 | 330 | 293 | 286 | 315 | 243 | 310 | 362 | 321 | 367 |
| 2021 | 412 | 236 | 237 | 326 | 393 | 327 | 321 | 323 | 317 | 349 | 337 | 340 |
| 2022 | 339 | 304 | 290 | 266 | 284 | 256 | 317 | 313 | 324 | 357 | 308 | 208 |
| 2023 | 338 | 292 | 360 | 262 | 281 | 287 | 311 | 234 | 306 | 301 | 351 | 326 |
| 2024 | 284 | 350 | 245 | 307 | ||||||||
| - = No Data Reported; -- = Not Applicable; NA = Not Available; W = Withheld to avoid disclosure of individual company data. |
| Release Date: 6/28/2024 |
| Next Release Date: 7/31/2024 |