|
Download Data (XLS File) |
|
||||||||
|
||||||||
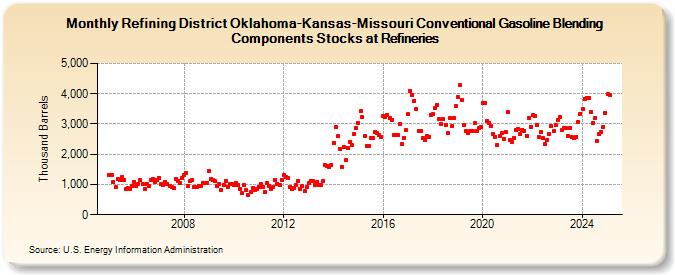
| Refining District Oklahoma-Kansas-Missouri Conventional Gasoline Blending Components Stocks at Refineries (Thousand Barrels) | ||||||||
| Year | Jan | Feb | Mar | Apr | May | Jun | Jul | Aug | Sep | Oct | Nov | Dec |
|---|---|---|---|---|---|---|---|---|---|---|---|---|
| 2005 | 1,325 | 1,324 | 1,093 | 921 | 1,184 | 1,151 | 1,241 | 1,148 | 860 | 878 | 851 | 938 |
| 2006 | 1,091 | 951 | 1,032 | 1,141 | 1,013 | 836 | 1,024 | 958 | 1,158 | 1,192 | 1,076 | 1,140 |
| 2007 | 1,220 | 1,010 | 970 | 1,084 | 1,014 | 962 | 915 | 871 | 1,176 | 1,128 | 1,046 | 1,228 |
| 2008 | 1,321 | 1,383 | 942 | 1,125 | 1,141 | 925 | 922 | 950 | 960 | 1,043 | 1,046 | 1,050 |
| 2009 | 1,438 | 1,170 | 1,132 | 1,106 | 965 | 1,029 | 823 | 975 | 1,122 | 928 | 999 | 1,007 |
| 2010 | 991 | 1,057 | 991 | 838 | 705 | 973 | 807 | 662 | 739 | 891 | 804 | 857 |
| 2011 | 923 | 1,030 | 932 | 759 | 1,063 | 959 | 846 | 932 | 1,140 | 1,030 | 976 | 1,161 |
| 2012 | 1,305 | 1,252 | 1,213 | 908 | 840 | 879 | 972 | 1,114 | 865 | 940 | 788 | 907 |
| 2013 | 1,047 | 1,129 | 1,112 | 993 | 1,082 | 997 | 997 | 1,112 | 1,633 | 1,609 | 1,564 | 1,652 |
| 2014 | 2,387 | 2,911 | 2,588 | 2,173 | 1,583 | 2,229 | 1,817 | 2,214 | 2,414 | 2,303 | 2,683 | 2,851 |
| 2015 | 3,041 | 3,420 | 3,216 | 2,591 | 2,274 | 2,286 | 2,544 | 2,536 | 2,743 | 2,694 | 2,636 | 2,571 |
| 2016 | 3,250 | 3,245 | 3,311 | 3,192 | 3,145 | 2,638 | 2,641 | 2,634 | 2,999 | 2,342 | 2,546 | 2,790 |
| 2017 | 3,316 | 4,095 | 3,963 | 3,766 | 3,500 | 2,769 | 2,759 | 2,529 | 2,486 | 2,594 | 2,581 | 3,311 |
| 2018 | 3,322 | 3,527 | 3,638 | 3,153 | 3,013 | 3,151 | 2,969 | 2,717 | 3,187 | 2,940 | 3,214 | 3,607 |
| 2019 | 3,876 | 4,280 | 3,782 | 2,959 | 2,766 | 2,718 | 2,753 | 2,759 | 3,039 | 2,759 | 2,872 | 2,895 |
| 2020 | 3,702 | 3,691 | 3,105 | 3,035 | 2,931 | 2,675 | 2,577 | 2,306 | 2,617 | 2,687 | 2,519 | 2,741 |
| 2021 | 3,393 | 2,458 | 2,403 | 2,549 | 2,815 | 2,844 | 2,665 | 2,817 | 2,779 | 2,618 | 3,201 | 2,911 |
| 2022 | 3,291 | 3,261 | 2,950 | 2,567 | 2,739 | 2,524 | 2,337 | 2,475 | 2,654 | 2,924 | 2,756 | 2,954 |
| 2023 | 3,146 | 3,224 | 2,792 | 2,864 | 2,861 | 2,611 | 2,859 | 2,553 | 2,548 | 2,572 | 3,072 | 3,340 |
| 2024 | 3,484 | |||||||||||
| - = No Data Reported; -- = Not Applicable; NA = Not Available; W = Withheld to avoid disclosure of individual company data. |
| Release Date: 3/29/2024 |
| Next Release Date: 4/30/2024 |