|
Download Data (XLS File) |
|
||||||||
|
||||||||
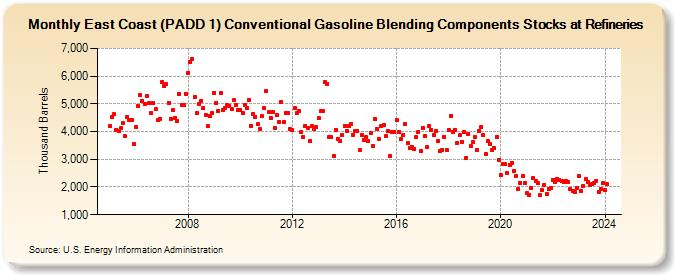
| East Coast (PADD 1) Conventional Gasoline Blending Components Stocks at Refineries (Thousand Barrels) | ||||||||
| Year | Jan | Feb | Mar | Apr | May | Jun | Jul | Aug | Sep | Oct | Nov | Dec |
|---|---|---|---|---|---|---|---|---|---|---|---|---|
| 2005 | 4,200 | 4,524 | 4,623 | 4,066 | 4,019 | 4,115 | 4,293 | 3,828 | 4,534 | 4,433 | 4,400 | 3,562 |
| 2006 | 4,162 | 4,926 | 5,328 | 5,100 | 4,991 | 5,276 | 5,015 | 4,673 | 5,026 | 4,809 | 4,400 | 4,454 |
| 2007 | 5,796 | 5,644 | 5,701 | 5,039 | 4,470 | 4,760 | 4,504 | 4,379 | 5,349 | 4,952 | 4,970 | 5,369 |
| 2008 | 6,125 | 6,492 | 6,602 | 5,256 | 4,652 | 5,006 | 5,117 | 4,845 | 4,612 | 4,195 | 4,568 | 4,656 |
| 2009 | 5,405 | 5,043 | 4,752 | 5,385 | 4,791 | 4,852 | 4,970 | 4,936 | 4,812 | 5,126 | 4,968 | 4,795 |
| 2010 | 4,793 | 4,665 | 4,972 | 4,853 | 5,134 | 4,193 | 4,630 | 4,541 | 4,267 | 4,076 | 4,550 | 4,836 |
| 2011 | 5,446 | 4,700 | 4,506 | 4,712 | 4,130 | 4,591 | 4,349 | 5,060 | 4,342 | 4,668 | 4,671 | 4,075 |
| 2012 | 4,057 | 4,835 | 4,655 | 4,749 | 3,974 | 3,808 | 4,217 | 4,121 | 3,663 | 4,190 | 4,077 | 4,153 |
| 2013 | 4,484 | 4,727 | 4,738 | 5,780 | 5,730 | 3,809 | 3,786 | 3,123 | 4,069 | 3,733 | 3,673 | 3,880 |
| 2014 | 4,207 | 4,022 | 4,200 | 4,290 | 3,886 | 4,025 | 4,025 | 3,323 | 3,885 | 3,682 | 3,791 | 3,662 |
| 2015 | 3,949 | 3,476 | 4,467 | 4,084 | 3,736 | 4,187 | 4,232 | 3,829 | 4,016 | 3,115 | 3,975 | 3,999 |
| 2016 | 4,399 | 3,982 | 3,731 | 3,880 | 4,262 | 3,571 | 3,409 | 3,452 | 3,385 | 3,795 | 3,995 | 3,285 |
| 2017 | 4,146 | 3,822 | 3,432 | 4,185 | 4,064 | 3,874 | 4,028 | 3,653 | 3,290 | 3,333 | 3,813 | 3,347 |
| 2018 | 4,061 | 4,578 | 3,999 | 4,067 | 3,578 | 3,862 | 3,632 | 3,979 | 3,050 | 3,909 | 3,467 | 3,620 |
| 2019 | 3,804 | 3,348 | 4,034 | 4,167 | 3,871 | 3,174 | 3,648 | 3,548 | 3,319 | 3,393 | 3,816 | 2,989 |
| 2020 | 2,437 | 2,838 | 2,814 | 2,500 | 2,803 | 2,882 | 2,574 | 2,402 | 1,941 | 2,160 | 2,409 | 2,149 |
| 2021 | 1,769 | 1,718 | 1,975 | 2,318 | 2,210 | 2,133 | 1,697 | 1,876 | 2,084 | 1,760 | 1,920 | 1,979 |
| 2022 | 2,268 | 2,176 | 2,283 | 2,259 | 2,230 | 2,166 | 2,206 | 2,171 | 1,910 | 1,860 | 1,807 | 1,953 |
| 2023 | 2,414 | 1,869 | 2,037 | 2,283 | 2,187 | 2,088 | 2,100 | 2,137 | 2,213 | 1,827 | 1,910 | 2,130 |
| 2024 | 1,878 | 2,097 | 2,090 | 1,827 | ||||||||
| - = No Data Reported; -- = Not Applicable; NA = Not Available; W = Withheld to avoid disclosure of individual company data. |
| Release Date: 6/28/2024 |
| Next Release Date: 7/31/2024 |