|
Download Data (XLS File) |
|
||||||||
|
||||||||
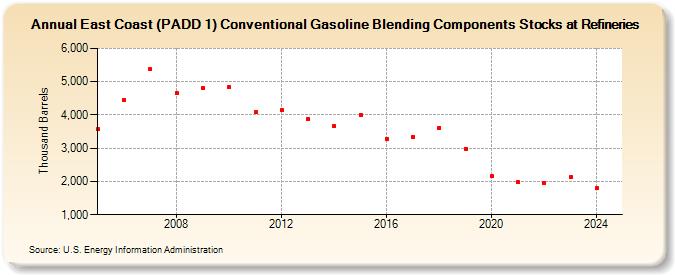
| East Coast (PADD 1) Conventional Gasoline Blending Components Stocks at Refineries (Thousand Barrels) | ||||||||
| Decade | Year-0 | Year-1 | Year-2 | Year-3 | Year-4 | Year-5 | Year-6 | Year-7 | Year-8 | Year-9 |
|---|---|---|---|---|---|---|---|---|---|---|
| 2000's | 3,562 | 4,454 | 5,369 | 4,656 | 4,795 | |||||
| 2010's | 4,836 | 4,075 | 4,153 | 3,880 | 3,662 | 3,999 | 3,285 | 3,347 | 3,620 | 2,989 |
| 2020's | 2,149 | 1,979 | 1,953 | 2,130 |
| - = No Data Reported; -- = Not Applicable; NA = Not Available; W = Withheld to avoid disclosure of individual company data. |
| Release Date: 6/28/2024 |
| Next Release Date: 8/30/2024 |