|
Download Data (XLS File) |
|
||||||||
|
||||||||
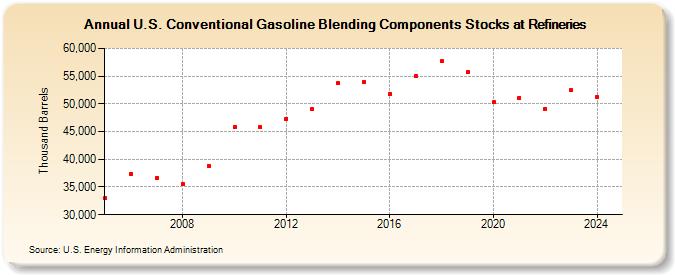
| U.S. Conventional Gasoline Blending Components Stocks at Refineries (Thousand Barrels) | ||||||||
| Decade | Year-0 | Year-1 | Year-2 | Year-3 | Year-4 | Year-5 | Year-6 | Year-7 | Year-8 | Year-9 |
|---|---|---|---|---|---|---|---|---|---|---|
| 2000's | 32,927 | 37,359 | 36,704 | 35,562 | 38,829 | |||||
| 2010's | 45,784 | 45,744 | 47,354 | 49,029 | 53,710 | 53,924 | 51,815 | 55,005 | 57,680 | 55,722 |
| 2020's | 50,283 | 51,136 | 49,084 | 52,491 |
| - = No Data Reported; -- = Not Applicable; NA = Not Available; W = Withheld to avoid disclosure of individual company data. |
| Release Date: 3/29/2024 |
| Next Release Date: 8/30/2024 |