|
Download Data (XLS File) |
|
||||||||
|
||||||||
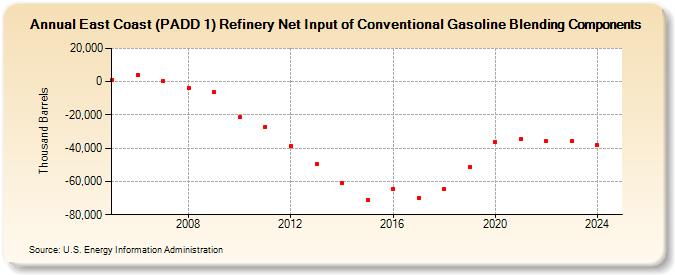
| East Coast (PADD 1) Refinery Net Input of Conventional Gasoline Blending Components (Thousand Barrels) | ||||||||
| Decade | Year-0 | Year-1 | Year-2 | Year-3 | Year-4 | Year-5 | Year-6 | Year-7 | Year-8 | Year-9 |
|---|---|---|---|---|---|---|---|---|---|---|
| 2000's | 1,106 | 4,146 | 462 | -3,668 | -6,285 | |||||
| 2010's | -21,437 | -27,069 | -38,727 | -49,760 | -61,080 | -71,248 | -64,248 | -70,163 | -64,410 | -51,256 |
| 2020's | -36,038 | -34,765 | -35,921 | -35,705 | -38,326 |
| - = No Data Reported; -- = Not Applicable; NA = Not Available; W = Withheld to avoid disclosure of individual company data. |
| Release Date: 6/30/2025 |
| Next Release Date: 8/29/2025 |