|
Download Data (XLS File) |
|
||||||||
|
||||||||
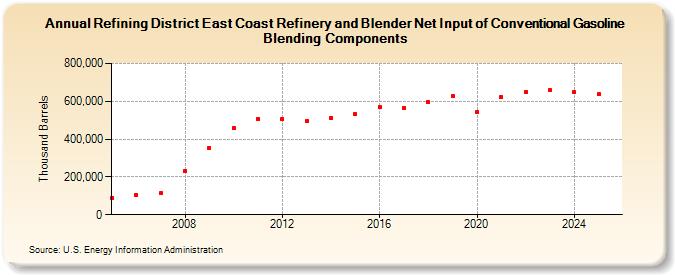
| Refining District East Coast Refinery and Blender Net Input of Conventional Gasoline Blending Components (Thousand Barrels) | ||||||||
| Decade | Year-0 | Year-1 | Year-2 | Year-3 | Year-4 | Year-5 | Year-6 | Year-7 | Year-8 | Year-9 |
|---|---|---|---|---|---|---|---|---|---|---|
| 2000's | 90,560 | 103,922 | 114,512 | 229,447 | 354,078 | |||||
| 2010's | 459,215 | 507,111 | 506,014 | 495,513 | 513,733 | 530,956 | 568,959 | 562,764 | 597,314 | 627,809 |
| 2020's | 541,142 | 622,198 | 650,427 | 658,431 |
| - = No Data Reported; -- = Not Applicable; NA = Not Available; W = Withheld to avoid disclosure of individual company data. |
| Release Date: 6/28/2024 |
| Next Release Date: 8/30/2024 |