|
Download Data (XLS File) |
|
||||||||
|
||||||||
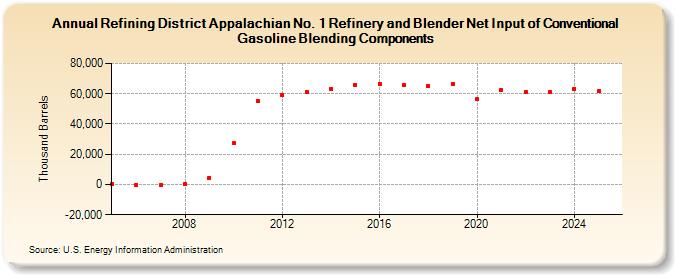
| Refining District Appalachian No. 1 Refinery and Blender Net Input of Conventional Gasoline Blending Components (Thousand Barrels) | ||||||||
| Decade | Year-0 | Year-1 | Year-2 | Year-3 | Year-4 | Year-5 | Year-6 | Year-7 | Year-8 | Year-9 |
|---|---|---|---|---|---|---|---|---|---|---|
| 2000's | -12 | -23 | -34 | 2 | 4,282 | |||||
| 2010's | 27,192 | 55,049 | 58,853 | 60,893 | 63,428 | 65,881 | 66,450 | 65,901 | 65,355 | 66,605 |
| 2020's | 56,272 | 62,429 | 61,314 | 60,940 |
| - = No Data Reported; -- = Not Applicable; NA = Not Available; W = Withheld to avoid disclosure of individual company data. |
| Release Date: 6/28/2024 |
| Next Release Date: 8/30/2024 |