|
Download Data (XLS File) |
|
||||||||
|
||||||||
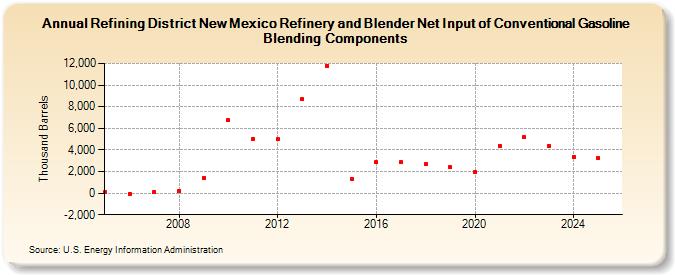
| Refining District New Mexico Refinery and Blender Net Input of Conventional Gasoline Blending Components (Thousand Barrels) | ||||||||
| Decade | Year-0 | Year-1 | Year-2 | Year-3 | Year-4 | Year-5 | Year-6 | Year-7 | Year-8 | Year-9 |
|---|---|---|---|---|---|---|---|---|---|---|
| 2000's | 68 | -60 | 123 | 224 | 1,427 | |||||
| 2010's | 6,738 | 5,034 | 4,965 | 8,695 | 11,813 | 1,324 | 2,856 | 2,852 | 2,663 | 2,372 |
| 2020's | 1,926 | 4,366 | 5,155 | 4,468 |
| - = No Data Reported; -- = Not Applicable; NA = Not Available; W = Withheld to avoid disclosure of individual company data. |
| Release Date: 3/29/2024 |
| Next Release Date: 8/30/2024 |