|
Download Data (XLS File) |
|
||||||||
|
||||||||
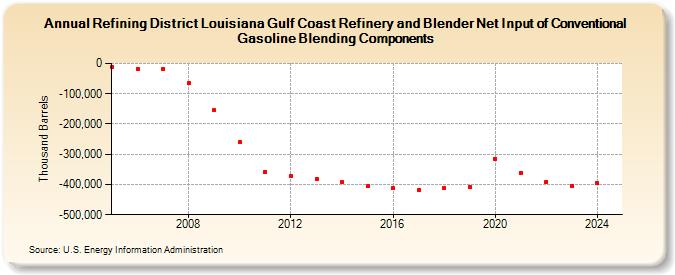
| Refining District Louisiana Gulf Coast Refinery and Blender Net Input of Conventional Gasoline Blending Components (Thousand Barrels) | ||||||||
| Decade | Year-0 | Year-1 | Year-2 | Year-3 | Year-4 | Year-5 | Year-6 | Year-7 | Year-8 | Year-9 |
|---|---|---|---|---|---|---|---|---|---|---|
| 2000's | -11,813 | -19,008 | -18,987 | -64,147 | -155,090 | |||||
| 2010's | -260,955 | -357,160 | -373,265 | -380,399 | -391,235 | -406,182 | -412,734 | -418,889 | -412,752 | -407,964 |
| 2020's | -314,275 | -360,890 | -390,233 | -404,240 |
| - = No Data Reported; -- = Not Applicable; NA = Not Available; W = Withheld to avoid disclosure of individual company data. |
| Release Date: 3/29/2024 |
| Next Release Date: 8/30/2024 |