|
Download Data (XLS File) |
|
||||||||
|
||||||||
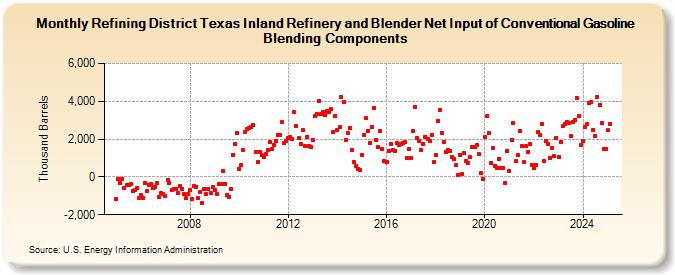
| Refining District Texas Inland Refinery and Blender Net Input of Conventional Gasoline Blending Components (Thousand Barrels) | ||||||||
| Year | Jan | Feb | Mar | Apr | May | Jun | Jul | Aug | Sep | Oct | Nov | Dec |
|---|---|---|---|---|---|---|---|---|---|---|---|---|
| 2005 | -1,146 | -117 | -301 | -118 | -563 | -449 | -403 | -373 | -740 | -714 | -594 | -1,104 |
| 2006 | -946 | -1,099 | -310 | -725 | -411 | -351 | -562 | -513 | -324 | -1,077 | -876 | -884 |
| 2007 | -1,028 | -156 | -311 | -703 | -662 | -644 | -860 | -473 | -614 | -924 | -1,136 | -924 |
| 2008 | -700 | -1,163 | -506 | -528 | -1,134 | -801 | -1,396 | -617 | -915 | -644 | -835 | -555 |
| 2009 | -675 | -907 | -392 | -370 | 326 | -350 | -953 | -1,047 | -618 | 1,184 | 1,722 | 2,324 |
| 2010 | 409 | 655 | 1,397 | 2,377 | 2,543 | 2,561 | 2,646 | 2,723 | 1,328 | 787 | 1,336 | 1,139 |
| 2011 | 1,070 | 1,220 | 1,416 | 1,853 | 1,488 | 1,704 | 1,876 | 2,204 | 2,192 | 2,912 | 1,773 | 1,904 |
| 2012 | 2,050 | 2,112 | 1,982 | 3,425 | 2,681 | 2,033 | 1,766 | 2,487 | 1,619 | 2,101 | 1,647 | 1,577 |
| 2013 | 1,971 | 3,198 | 3,303 | 4,002 | 3,328 | 3,410 | 3,258 | 3,474 | 3,426 | 3,566 | 2,352 | 3,215 |
| 2014 | 2,479 | 2,648 | 4,234 | 3,938 | 1,949 | 2,327 | 2,608 | 1,399 | 763 | 599 | 406 | 377 |
| 2015 | 1,176 | 2,208 | 3,101 | 2,440 | 1,820 | 2,659 | 3,657 | 1,943 | 1,572 | 2,450 | 1,453 | 844 |
| 2016 | 785 | 1,356 | 1,736 | 1,406 | 1,358 | 1,798 | 1,692 | 1,732 | 1,800 | 1,828 | 1,003 | 1,486 |
| 2017 | 985 | 2,424 | 3,685 | 2,061 | 1,873 | 1,449 | 1,743 | 2,115 | 2,000 | 1,892 | 2,219 | 776 |
| 2018 | 1,161 | 2,980 | 3,552 | 2,343 | 1,839 | 1,337 | 1,417 | 1,377 | 1,052 | 961 | 610 | 105 |
| 2019 | 1,166 | 180 | 1,258 | 867 | 737 | 1,065 | 1,576 | 1,591 | 1,663 | 1,200 | 193 | -111 |
| 2020 | 2,099 | 3,198 | 2,298 | 762 | 1,506 | 564 | 474 | 943 | 459 | 467 | -312 | 1,374 |
| 2021 | 337 | 1,970 | 2,826 | 817 | 1,157 | 2,418 | 1,626 | 775 | 1,613 | 1,336 | 1,744 | 625 |
| 2022 | 461 | 656 | 2,374 | 2,236 | 2,777 | 816 | 1,885 | 1,759 | 1,023 | 1,525 | 1,088 | 2,073 |
| 2023 | 977 | 1,707 | 2,663 | 2,820 | 2,906 | 2,986 | 2,137 | 2,929 | 3,027 | 4,193 | 3,243 | 1,632 |
| 2024 | 1,876 | |||||||||||
| - = No Data Reported; -- = Not Applicable; NA = Not Available; W = Withheld to avoid disclosure of individual company data. |
| Release Date: 3/29/2024 |
| Next Release Date: 4/30/2024 |