|
Download Data (XLS File) |
|
||||||||
|
||||||||
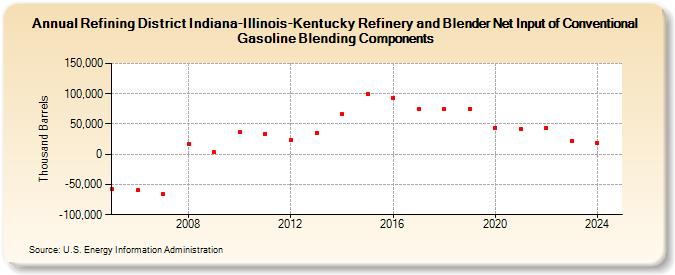
| Refining District Indiana-Illinois-Kentucky Refinery and Blender Net Input of Conventional Gasoline Blending Components (Thousand Barrels) | ||||||||
| Decade | Year-0 | Year-1 | Year-2 | Year-3 | Year-4 | Year-5 | Year-6 | Year-7 | Year-8 | Year-9 |
|---|---|---|---|---|---|---|---|---|---|---|
| 2000's | -56,867 | -59,858 | -66,065 | 16,985 | 3,078 | |||||
| 2010's | 36,431 | 33,014 | 22,881 | 35,787 | 66,634 | 100,360 | 93,558 | 74,693 | 74,461 | 75,291 |
| 2020's | 43,907 | 42,097 | 43,225 | 22,587 |
| - = No Data Reported; -- = Not Applicable; NA = Not Available; W = Withheld to avoid disclosure of individual company data. |
| Release Date: 6/28/2024 |
| Next Release Date: 8/30/2024 |