|
Download Data (XLS File) |
|
||||||||
|
||||||||
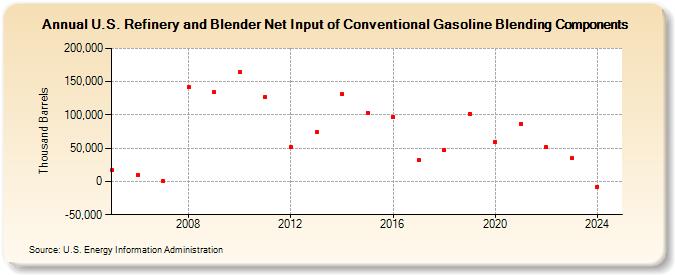
| U.S. Refinery and Blender Net Input of Conventional Gasoline Blending Components (Thousand Barrels) | ||||||||
| Decade | Year-0 | Year-1 | Year-2 | Year-3 | Year-4 | Year-5 | Year-6 | Year-7 | Year-8 | Year-9 |
|---|---|---|---|---|---|---|---|---|---|---|
| 2000's | 16,490 | 10,110 | 551 | 142,225 | 134,042 | |||||
| 2010's | 163,921 | 127,077 | 52,413 | 73,888 | 131,577 | 103,636 | 96,654 | 32,076 | 46,598 | 101,828 |
| 2020's | 60,037 | 86,497 | 51,154 | 34,040 |
| - = No Data Reported; -- = Not Applicable; NA = Not Available; W = Withheld to avoid disclosure of individual company data. |
| Release Date: 3/29/2024 |
| Next Release Date: 8/30/2024 |