|
Download Data (XLS File) |
|
||||||||
|
||||||||
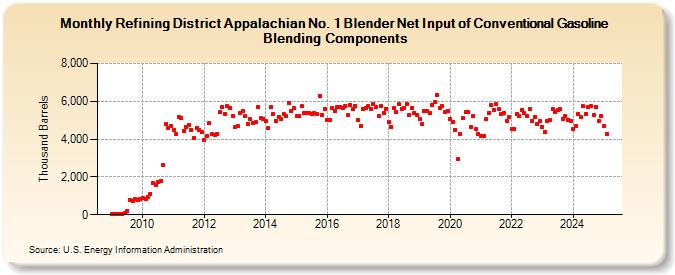
| Refining District Appalachian No. 1 Blender Net Input of Conventional Gasoline Blending Components (Thousand Barrels) | ||||||||
| Year | Jan | Feb | Mar | Apr | May | Jun | Jul | Aug | Sep | Oct | Nov | Dec |
|---|---|---|---|---|---|---|---|---|---|---|---|---|
| 2009 | 13 | 25 | 20 | 29 | 30 | 67 | 218 | 783 | 709 | 819 | 756 | 813 |
| 2010 | 879 | 841 | 952 | 1,118 | 1,669 | 1,596 | 1,754 | 1,773 | 2,612 | 4,805 | 4,565 | 4,715 |
| 2011 | 4,490 | 4,271 | 5,192 | 5,113 | 4,442 | 4,619 | 4,751 | 4,490 | 4,049 | 4,600 | 4,476 | 4,388 |
| 2012 | 3,956 | 4,158 | 4,827 | 4,244 | 4,242 | 4,295 | 5,417 | 5,713 | 5,330 | 5,736 | 5,659 | 5,218 |
| 2013 | 4,629 | 4,668 | 5,380 | 5,470 | 5,205 | 4,795 | 5,039 | 4,840 | 4,880 | 5,704 | 5,124 | 5,076 |
| 2014 | 4,965 | 4,595 | 5,700 | 5,311 | 4,975 | 5,149 | 5,058 | 5,354 | 5,204 | 5,917 | 5,492 | 5,620 |
| 2015 | 5,214 | 5,223 | 5,727 | 5,392 | 5,392 | 5,402 | 5,347 | 5,387 | 5,349 | 6,296 | 5,289 | 5,591 |
| 2016 | 5,036 | 5,025 | 5,650 | 5,501 | 5,685 | 5,721 | 5,645 | 5,768 | 5,257 | 5,813 | 5,577 | 5,740 |
| 2017 | 4,996 | 4,698 | 5,584 | 5,627 | 5,733 | 5,587 | 5,864 | 5,709 | 5,233 | 5,770 | 5,390 | 5,610 |
| 2018 | 4,929 | 4,641 | 5,625 | 5,423 | 5,833 | 5,604 | 5,646 | 5,874 | 5,290 | 5,637 | 5,399 | 5,250 |
| 2019 | 5,051 | 4,786 | 5,466 | 5,460 | 5,357 | 5,801 | 5,953 | 6,339 | 5,652 | 5,753 | 5,424 | 5,492 |
| 2020 | 5,051 | 4,910 | 4,498 | 2,947 | 4,260 | 5,094 | 5,410 | 5,416 | 4,654 | 5,205 | 4,520 | 4,267 |
| 2021 | 4,160 | 4,184 | 5,045 | 5,403 | 5,830 | 5,531 | 5,862 | 5,572 | 5,307 | 5,363 | 4,970 | 5,165 |
| 2022 | 4,550 | 4,513 | 5,352 | 5,209 | 5,520 | 5,365 | 5,234 | 5,585 | 4,977 | 5,171 | 4,791 | 4,950 |
| 2023 | 4,570 | 4,324 | 4,857 | 4,922 | 5,477 | 5,307 | 5,516 | 5,591 | 5,170 | 5,247 | 5,035 | 4,980 |
| 2024 | 4,531 | 4,690 | 5,312 | 5,195 | ||||||||
| - = No Data Reported; -- = Not Applicable; NA = Not Available; W = Withheld to avoid disclosure of individual company data. |
| Release Date: 6/28/2024 |
| Next Release Date: 7/31/2024 |