|
Download Data (XLS File) |
|
||||||||
|
||||||||
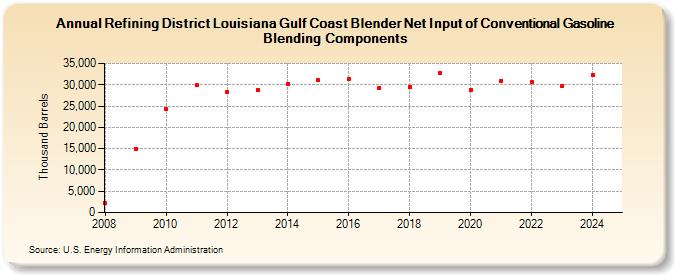
| Refining District Louisiana Gulf Coast Blender Net Input of Conventional Gasoline Blending Components (Thousand Barrels) | ||||||||
| Decade | Year-0 | Year-1 | Year-2 | Year-3 | Year-4 | Year-5 | Year-6 | Year-7 | Year-8 | Year-9 |
|---|---|---|---|---|---|---|---|---|---|---|
| 2000's | 2,157 | 14,986 | ||||||||
| 2010's | 24,217 | 29,908 | 28,233 | 28,721 | 30,186 | 31,050 | 31,458 | 29,280 | 29,398 | 32,736 |
| 2020's | 28,872 | 30,947 | 30,667 | 29,744 |
| - = No Data Reported; -- = Not Applicable; NA = Not Available; W = Withheld to avoid disclosure of individual company data. |
| Release Date: 8/30/2024 |
| Next Release Date: 8/29/2025 |