|
Download Data (XLS File) |
|
||||||||
|
||||||||
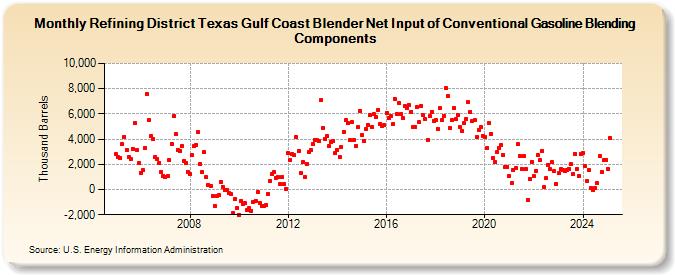
| Refining District Texas Gulf Coast Blender Net Input of Conventional Gasoline Blending Components (Thousand Barrels) | ||||||||
| Year | Jan | Feb | Mar | Apr | May | Jun | Jul | Aug | Sep | Oct | Nov | Dec |
|---|---|---|---|---|---|---|---|---|---|---|---|---|
| 2005 | 2,792 | 2,544 | 2,518 | 3,586 | 4,189 | 3,172 | 2,584 | 2,438 | 3,244 | 5,258 | 3,147 | 2,095 |
| 2006 | 1,343 | 1,527 | 3,312 | 7,550 | 5,505 | 4,228 | 3,977 | 2,555 | 2,416 | 2,139 | 1,379 | 1,101 |
| 2007 | 956 | 1,051 | 2,332 | 3,641 | 5,813 | 4,382 | 3,120 | 3,083 | 3,448 | 2,245 | 2,110 | 1,418 |
| 2008 | 1,232 | 2,699 | 3,414 | 3,552 | 4,526 | 2,026 | 1,383 | 2,938 | 955 | 364 | 260 | -505 |
| 2009 | -1,280 | -480 | -456 | 623 | 199 | -72 | -38 | -313 | -384 | -1,897 | -753 | -1,440 |
| 2010 | -1,991 | -899 | -1,136 | -1,096 | -1,655 | -1,494 | -1,683 | -1,002 | -874 | -179 | -1,095 | -1,290 |
| 2011 | -1,313 | -1,257 | -353 | 656 | 1,213 | 1,370 | 946 | 979 | 431 | 978 | 419 | 45 |
| 2012 | 2,876 | 2,361 | 2,818 | 2,722 | 4,153 | 3,040 | 1,307 | 2,155 | 976 | 2,027 | 2,937 | 3,131 |
| 2013 | 3,574 | 3,954 | 3,898 | 3,843 | 7,080 | 4,909 | 4,026 | 4,236 | 3,415 | 3,804 | 3,843 | 2,888 |
| 2014 | 3,147 | 2,618 | 3,386 | 4,600 | 5,490 | 5,241 | 3,916 | 5,324 | 3,937 | 3,473 | 4,952 | 6,248 |
| 2015 | 4,306 | 3,814 | 4,820 | 5,136 | 5,874 | 4,963 | 5,970 | 5,743 | 6,333 | 5,182 | 5,057 | 5,092 |
| 2016 | 6,092 | 5,645 | 5,843 | 5,169 | 7,213 | 5,977 | 6,862 | 6,007 | 5,644 | 6,605 | 6,472 | 6,690 |
| 2017 | 6,186 | 4,926 | 4,957 | 6,525 | 5,321 | 6,641 | 5,880 | 5,573 | 3,947 | 5,810 | 6,169 | 5,445 |
| 2018 | 5,503 | 4,837 | 6,443 | 5,500 | 5,871 | 8,052 | 7,413 | 4,882 | 5,493 | 6,451 | 5,567 | 5,882 |
| 2019 | 4,933 | 4,642 | 5,241 | 5,626 | 6,904 | 6,184 | 5,462 | 5,481 | 4,134 | 4,706 | 4,995 | 4,261 |
| 2020 | 4,163 | 3,272 | 5,258 | 4,437 | 2,529 | 2,216 | 2,982 | 3,331 | 3,497 | 2,723 | 1,783 | 1,819 |
| 2021 | 1,054 | 485 | 1,582 | 1,685 | 3,573 | 2,641 | 1,667 | 2,629 | 1,643 | -814 | 841 | 2,189 |
| 2022 | 1,051 | 1,497 | 2,724 | 2,305 | 3,085 | 171 | 892 | 1,983 | 1,589 | 2,168 | 1,432 | 452 |
| 2023 | 1,287 | 1,596 | 1,520 | 1,439 | 1,582 | 1,665 | 1,999 | 1,220 | 2,813 | 1,646 | 1,082 | 2,822 |
| 2024 | 2,925 | 1,858 | 652 | 1,521 | ||||||||
| - = No Data Reported; -- = Not Applicable; NA = Not Available; W = Withheld to avoid disclosure of individual company data. |
| Release Date: 6/28/2024 |
| Next Release Date: 7/31/2024 |