|
Download Data (XLS File) |
|
||||||||
|
||||||||
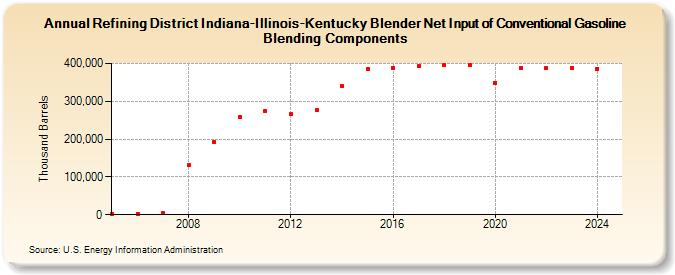
| Refining District Indiana-Illinois-Kentucky Blender Net Input of Conventional Gasoline Blending Components (Thousand Barrels) | ||||||||
| Decade | Year-0 | Year-1 | Year-2 | Year-3 | Year-4 | Year-5 | Year-6 | Year-7 | Year-8 | Year-9 |
|---|---|---|---|---|---|---|---|---|---|---|
| 2000's | 2,014 | 2,744 | 3,685 | 130,760 | 192,621 | |||||
| 2010's | 259,181 | 274,150 | 265,176 | 275,883 | 340,854 | 384,815 | 389,249 | 392,119 | 396,791 | 395,895 |
| 2020's | 349,147 | 387,628 | 386,880 | 389,203 |
| - = No Data Reported; -- = Not Applicable; NA = Not Available; W = Withheld to avoid disclosure of individual company data. |
| Release Date: 3/29/2024 |
| Next Release Date: 8/30/2024 |