|
Download Data (XLS File) |
|
||||||||
|
||||||||
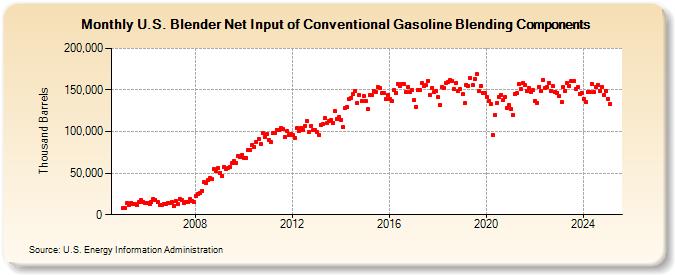
| U.S. Blender Net Input of Conventional Gasoline Blending Components (Thousand Barrels) | ||||||||
| Year | Jan | Feb | Mar | Apr | May | Jun | Jul | Aug | Sep | Oct | Nov | Dec |
|---|---|---|---|---|---|---|---|---|---|---|---|---|
| 2005 | 8,385 | 8,498 | 13,534 | 11,730 | 14,150 | 13,085 | 12,656 | 11,895 | 15,266 | 17,484 | 15,366 | 14,269 |
| 2006 | 13,707 | 12,665 | 15,286 | 18,986 | 17,816 | 15,396 | 12,262 | 12,037 | 12,911 | 13,366 | 13,654 | 13,812 |
| 2007 | 15,219 | 10,980 | 16,983 | 12,907 | 19,180 | 17,169 | 14,110 | 15,726 | 15,304 | 18,299 | 16,678 | 14,826 |
| 2008 | 22,627 | 25,501 | 25,539 | 28,734 | 38,987 | 38,718 | 41,163 | 43,947 | 42,540 | 54,817 | 52,262 | 55,643 |
| 2009 | 50,740 | 46,387 | 57,700 | 55,394 | 55,789 | 57,911 | 61,867 | 64,349 | 62,623 | 70,953 | 69,257 | 72,245 |
| 2010 | 68,755 | 68,556 | 78,175 | 78,204 | 84,316 | 81,492 | 88,029 | 90,768 | 85,189 | 97,710 | 93,887 | 96,582 |
| 2011 | 90,032 | 87,469 | 97,859 | 98,857 | 102,338 | 101,307 | 104,661 | 102,856 | 93,295 | 100,863 | 96,001 | 97,237 |
| 2012 | 95,375 | 92,532 | 103,917 | 100,614 | 104,637 | 101,645 | 106,900 | 112,355 | 99,327 | 106,905 | 101,743 | 101,894 |
| 2013 | 98,928 | 96,237 | 108,340 | 108,490 | 115,794 | 110,372 | 112,606 | 114,299 | 110,843 | 124,134 | 115,491 | 117,204 |
| 2014 | 113,911 | 105,297 | 128,608 | 129,378 | 139,507 | 140,777 | 144,845 | 148,907 | 134,342 | 143,726 | 136,486 | 142,699 |
| 2015 | 137,080 | 126,831 | 143,793 | 143,709 | 149,254 | 147,136 | 153,271 | 152,722 | 146,112 | 146,633 | 138,660 | 143,856 |
| 2016 | 139,126 | 136,324 | 149,596 | 146,723 | 157,507 | 154,500 | 157,627 | 156,947 | 147,015 | 153,279 | 147,094 | 149,431 |
| 2017 | 137,633 | 129,976 | 150,464 | 150,020 | 158,213 | 155,030 | 155,637 | 161,118 | 143,966 | 152,558 | 147,246 | 148,233 |
| 2018 | 141,046 | 132,066 | 153,177 | 152,297 | 158,979 | 158,987 | 161,678 | 160,216 | 150,730 | 158,451 | 149,067 | 150,601 |
| 2019 | 144,737 | 133,995 | 156,533 | 154,896 | 164,502 | 155,732 | 163,271 | 169,170 | 148,436 | 154,773 | 146,952 | 146,758 |
| 2020 | 142,052 | 137,162 | 132,796 | 96,044 | 119,661 | 134,085 | 142,124 | 144,295 | 137,809 | 141,747 | 128,424 | 131,694 |
| 2021 | 126,682 | 119,664 | 145,420 | 145,874 | 157,043 | 151,420 | 158,588 | 155,462 | 149,081 | 151,994 | 147,420 | 149,596 |
| 2022 | 136,536 | 134,410 | 153,906 | 148,295 | 162,336 | 152,004 | 153,926 | 158,776 | 148,603 | 154,231 | 147,917 | 146,777 |
| 2023 | 142,077 | 135,269 | 154,074 | 148,871 | 158,110 | 154,873 | 161,024 | 160,545 | 151,483 | 153,234 | 145,110 | 146,479 |
| 2024 | 139,046 | 136,014 | 147,579 | 147,983 | ||||||||
| - = No Data Reported; -- = Not Applicable; NA = Not Available; W = Withheld to avoid disclosure of individual company data. |
| Release Date: 6/28/2024 |
| Next Release Date: 7/31/2024 |