|
Download Data (XLS File) |
|
||||||||
|
||||||||
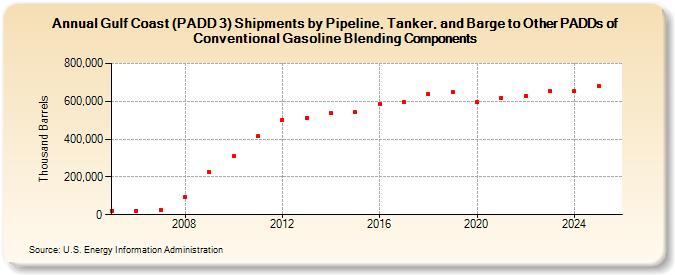
| Gulf Coast (PADD 3) Shipments by Pipeline, Tanker, and Barge to Other PADDs of Conventional Gasoline Blending Components (Thousand Barrels) | ||||||||
| Decade | Year-0 | Year-1 | Year-2 | Year-3 | Year-4 | Year-5 | Year-6 | Year-7 | Year-8 | Year-9 |
|---|---|---|---|---|---|---|---|---|---|---|
| 2000's | 21,426 | 21,411 | 26,447 | 95,920 | 223,707 | |||||
| 2010's | 308,661 | 414,219 | 502,233 | 513,046 | 538,144 | 541,888 | 584,199 | 596,413 | 641,117 | 650,128 |
| 2020's | 594,690 | 619,845 | 629,114 | 652,688 |
| - = No Data Reported; -- = Not Applicable; NA = Not Available; W = Withheld to avoid disclosure of individual company data. |
| Release Date: 3/29/2024 |
| Next Release Date: 8/30/2024 |
Referring Pages: