|
Download Data (XLS File) |
|
||||||||
|
||||||||
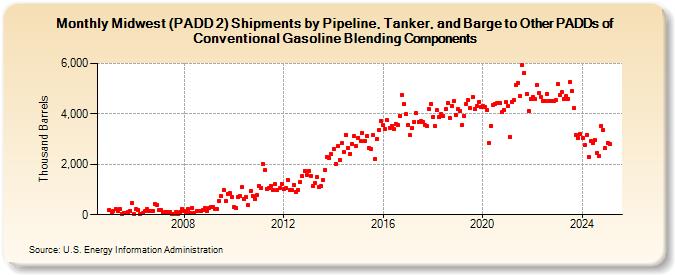
| Midwest (PADD 2) Shipments by Pipeline, Tanker, and Barge to Other PADDs of Conventional Gasoline Blending Components (Thousand Barrels) | ||||||||
| Year | Jan | Feb | Mar | Apr | May | Jun | Jul | Aug | Sep | Oct | Nov | Dec |
|---|---|---|---|---|---|---|---|---|---|---|---|---|
| 2005 | 187 | 106 | 154 | 231 | 136 | 239 | 47 | 87 | 67 | 92 | 163 | 465 |
| 2006 | 9 | 220 | 174 | 26 | 57 | 143 | 226 | 141 | 142 | 163 | 416 | 389 |
| 2007 | 189 | 180 | 56 | 88 | 125 | 92 | 40 | 34 | 102 | 25 | 89 | 227 |
| 2008 | 138 | 97 | 216 | 71 | 274 | 66 | 161 | 162 | 155 | 180 | 264 | 158 |
| 2009 | 275 | 320 | 319 | 221 | 211 | 549 | 751 | 984 | 541 | 826 | 848 | 705 |
| 2010 | 290 | 286 | 692 | 757 | 1,081 | 634 | 702 | 366 | 938 | 753 | 605 | 776 |
| 2011 | 1,132 | 1,061 | 2,009 | 1,756 | 1,016 | 1,067 | 1,152 | 962 | 1,200 | 982 | 1,047 | 1,227 |
| 2012 | 1,001 | 1,048 | 1,390 | 995 | 977 | 1,193 | 895 | 992 | 1,293 | 1,527 | 1,728 | 1,567 |
| 2013 | 1,746 | 1,555 | 1,137 | 1,242 | 1,495 | 1,118 | 1,129 | 1,368 | 1,789 | 2,300 | 2,249 | 2,407 |
| 2014 | 2,611 | 2,027 | 2,712 | 2,189 | 2,827 | 2,496 | 3,180 | 2,641 | 2,423 | 2,812 | 3,116 | 2,716 |
| 2015 | 3,059 | 2,933 | 3,254 | 2,944 | 3,116 | 2,641 | 2,613 | 3,158 | 2,191 | 3,018 | 3,361 | 3,723 |
| 2016 | 3,550 | 3,386 | 3,740 | 3,458 | 3,523 | 3,391 | 3,612 | 3,553 | 3,916 | 4,754 | 4,389 | 3,991 |
| 2017 | 3,563 | 3,155 | 3,437 | 3,685 | 4,029 | 3,689 | 3,704 | 3,678 | 3,570 | 3,503 | 4,193 | 4,405 |
| 2018 | 3,884 | 3,504 | 4,140 | 3,867 | 3,991 | 3,920 | 4,182 | 4,432 | 3,851 | 4,327 | 4,501 | 3,955 |
| 2019 | 4,181 | 4,095 | 3,558 | 3,931 | 4,405 | 4,539 | 4,222 | 4,676 | 4,203 | 4,320 | 4,480 | 4,270 |
| 2020 | 4,329 | 4,292 | 4,145 | 2,847 | 3,536 | 4,361 | 4,408 | 4,444 | 4,429 | 4,069 | 4,166 | 4,459 |
| 2021 | 4,294 | 3,094 | 4,479 | 4,547 | 5,136 | 5,234 | 4,716 | 5,921 | 5,629 | 4,807 | 4,122 | 4,610 |
| 2022 | 4,682 | 4,573 | 5,143 | 4,831 | 4,685 | 4,525 | 4,531 | 4,797 | 4,500 | 4,496 | 4,499 | 4,540 |
| 2023 | 5,174 | 4,735 | 4,851 | 4,592 | 4,693 | 4,605 | 5,259 | 4,915 | 4,223 | 3,158 | 3,053 | 3,193 |
| 2024 | 3,056 | |||||||||||
| - = No Data Reported; -- = Not Applicable; NA = Not Available; W = Withheld to avoid disclosure of individual company data. |
| Release Date: 3/29/2024 |
| Next Release Date: 4/30/2024 |
Referring Pages: