|
Download Data (XLS File) |
|
||||||||
|
||||||||
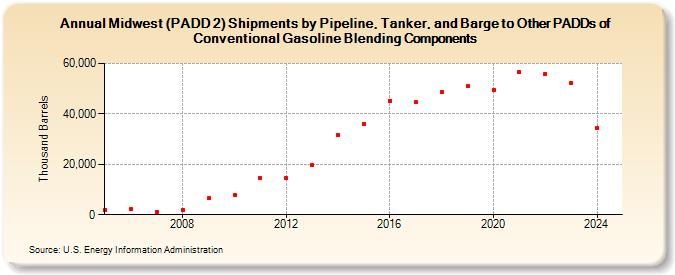
| Midwest (PADD 2) Shipments by Pipeline, Tanker, and Barge to Other PADDs of Conventional Gasoline Blending Components (Thousand Barrels) | ||||||||
| Decade | Year-0 | Year-1 | Year-2 | Year-3 | Year-4 | Year-5 | Year-6 | Year-7 | Year-8 | Year-9 |
|---|---|---|---|---|---|---|---|---|---|---|
| 2000's | 1,974 | 2,106 | 1,247 | 1,942 | 6,550 | |||||
| 2010's | 7,880 | 14,611 | 14,606 | 19,535 | 31,750 | 36,011 | 45,263 | 44,611 | 48,554 | 50,880 |
| 2020's | 49,485 | 56,589 | 55,802 | 52,451 | 34,348 |
| - = No Data Reported; -- = Not Applicable; NA = Not Available; W = Withheld to avoid disclosure of individual company data. |
| Release Date: 6/30/2025 |
| Next Release Date: 8/29/2025 |
Referring Pages: