|
Download Data (XLS File) |
|
||||||||
|
||||||||
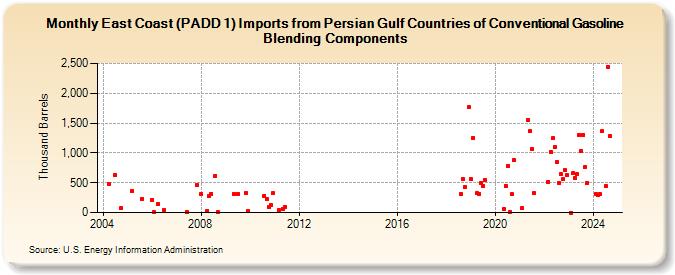
| East Coast (PADD 1) Imports from Persian Gulf Countries of Conventional Gasoline Blending Components (Thousand Barrels) | ||||||||
| Year | Jan | Feb | Mar | Apr | May | Jun | Jul | Aug | Sep | Oct | Nov | Dec |
|---|---|---|---|---|---|---|---|---|---|---|---|---|
| 2004 | 481 | 628 | 72 | |||||||||
| 2005 | 359 | 235 | ||||||||||
| 2006 | 215 | 9 | 145 | 38 | ||||||||
| 2007 | 16 | 465 | ||||||||||
| 2008 | 313 | 33 | 283 | 318 | 618 | 12 | ||||||
| 2009 | 315 | 319 | 330 | 20 | ||||||||
| 2010 | 280 | 230 | 100 | 129 | 321 | |||||||
| 2011 | 37 | 67 | 95 | |||||||||
| 2018 | 305 | 559 | 425 | 1,769 | ||||||||
| 2019 | 558 | 1,251 | 321 | 319 | 492 | 451 | 545 | |||||
| 2020 | 52 | 451 | 786 | 10 | 309 | 877 | ||||||
| 2021 | 79 | 1,547 | 1,360 | 1,065 | 323 | |||||||
| 2022 | 518 | 1,018 | 1,244 | 1,092 | 847 | 502 | 645 | 556 | 707 | 623 | ||
| 2023 | 1 | 656 | 587 | 646 | 1,309 | 1,030 | 1,309 | 765 | 503 | |||
| 2024 | 309 | 300 | 308 | 1,363 | 447 | 2,441 | 1,288 | |||||
| 2025 | 32 | 963 | ||||||||||
| - = No Data Reported; -- = Not Applicable; NA = Not Available; W = Withheld to avoid disclosure of individual company data. |
| Release Date: 6/30/2025 |
| Next Release Date: 7/31/2025 |