|
Download Data (XLS File) |
|
||||||||
|
||||||||
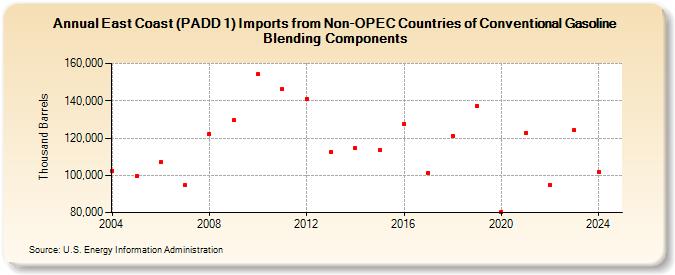
| East Coast (PADD 1) Imports from Non-OPEC Countries of Conventional Gasoline Blending Components (Thousand Barrels) | ||||||||
| Decade | Year-0 | Year-1 | Year-2 | Year-3 | Year-4 | Year-5 | Year-6 | Year-7 | Year-8 | Year-9 |
|---|---|---|---|---|---|---|---|---|---|---|
| 2000's | 102,368 | 99,683 | 107,050 | 94,780 | 122,107 | 129,666 | ||||
| 2010's | 154,174 | 146,211 | 141,133 | 112,468 | 114,772 | 113,697 | 127,342 | 101,432 | 121,147 | 137,306 |
| 2020's | 80,500 | 122,764 | 94,948 | 124,291 |
| - = No Data Reported; -- = Not Applicable; NA = Not Available; W = Withheld to avoid disclosure of individual company data. |
| Release Date: 3/29/2024 |
| Next Release Date: 8/30/2024 |