|
Download Data (XLS File) |
|
||||||||
|
||||||||
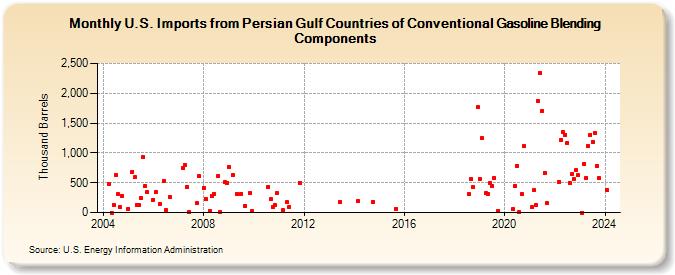
| U.S. Imports from Persian Gulf Countries of Conventional Gasoline Blending Components (Thousand Barrels) | ||||||||
| Year | Jan | Feb | Mar | Apr | May | Jun | Jul | Aug | Sep | Oct | Nov | Dec |
|---|---|---|---|---|---|---|---|---|---|---|---|---|
| 2004 | 481 | 1 | 130 | 628 | 305 | 100 | 282 | |||||
| 2005 | 64 | 685 | 589 | 130 | 122 | 250 | 929 | 445 | 344 | |||
| 2006 | 215 | 339 | 145 | 535 | 38 | 262 | ||||||
| 2007 | 755 | 802 | 437 | 16 | 159 | 612 | ||||||
| 2008 | 413 | 226 | 33 | 283 | 318 | 618 | 12 | 505 | 496 | |||
| 2009 | 769 | 630 | 315 | 319 | 112 | 330 | 20 | |||||
| 2010 | 433 | 230 | 100 | 129 | 321 | |||||||
| 2011 | 37 | 176 | 95 | 501 | ||||||||
| 2013 | 174 | |||||||||||
| 2014 | 188 | 185 | ||||||||||
| 2015 | 64 | |||||||||||
| 2018 | 305 | 559 | 425 | 1,769 | ||||||||
| 2019 | 558 | 1,251 | 321 | 319 | 492 | 451 | 581 | 31 | ||||
| 2020 | 52 | 451 | 786 | 10 | 309 | 1,111 | ||||||
| 2021 | 88 | 370 | 135 | 1,874 | 2,346 | 1,705 | 664 | 158 | ||||
| 2022 | 518 | 1,213 | 1,346 | 1,307 | 1,171 | 502 | 645 | 556 | 707 | 623 | ||
| 2023 | 1 | 820 | 587 | 1,123 | 1,309 | 1,184 | 1,336 | 789 | 576 | |||
| 2024 | 375 | 496 | 345 | |||||||||
| - = No Data Reported; -- = Not Applicable; NA = Not Available; W = Withheld to avoid disclosure of individual company data. |
| Release Date: 6/28/2024 |
| Next Release Date: 7/31/2024 |