|
Download Data (XLS File) |
|
||||||||
|
||||||||
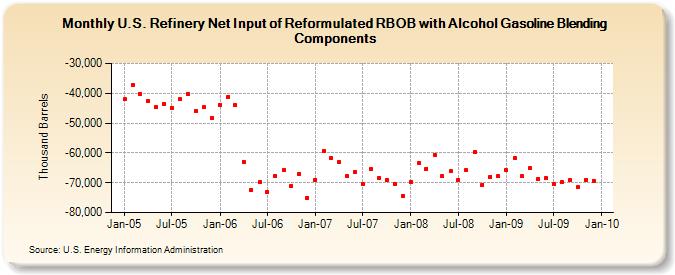
| U.S. Refinery Net Input of Reformulated RBOB with Alcohol Gasoline Blending Components (Thousand Barrels) | ||||||||
| Year | Jan | Feb | Mar | Apr | May | Jun | Jul | Aug | Sep | Oct | Nov | Dec |
|---|---|---|---|---|---|---|---|---|---|---|---|---|
| 2005 | -42,047 | -37,188 | -40,077 | -42,570 | -44,677 | -43,424 | -44,880 | -42,049 | -40,105 | -45,885 | -44,714 | -48,245 |
| 2006 | -43,766 | -41,126 | -44,064 | -62,875 | -72,314 | -69,906 | -73,112 | -67,711 | -65,794 | -71,018 | -67,114 | -74,998 |
| 2007 | -68,940 | -59,272 | -61,687 | -63,160 | -67,754 | -66,366 | -70,461 | -65,525 | -68,270 | -69,229 | -70,543 | -74,308 |
| 2008 | -69,823 | -63,348 | -65,267 | -60,578 | -67,799 | -66,217 | -69,146 | -65,852 | -59,804 | -70,589 | -67,913 | -67,854 |
| 2009 | -65,816 | -61,590 | -67,766 | -65,057 | -68,878 | -68,443 | -70,548 | -69,678 | -69,244 | -71,434 | -69,069 | -69,269 |
| - = No Data Reported; -- = Not Applicable; NA = Not Available; W = Withheld to avoid disclosure of individual company data. |
| Release Date: 3/29/2024 |
| Next Release Date: 4/30/2024 |