|
Download Data (XLS File) |
|
||||||||
|
||||||||
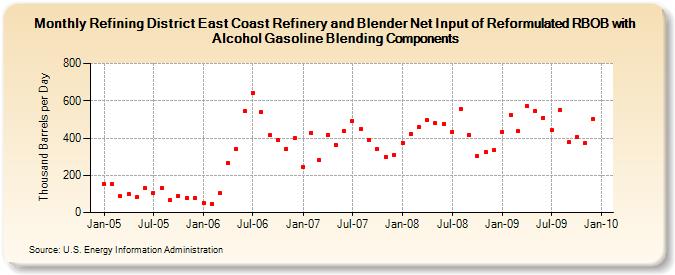
| Refining District East Coast Refinery and Blender Net Input of Reformulated RBOB with Alcohol Gasoline Blending Components (Thousand Barrels per Day) | ||||||||
| Year | Jan | Feb | Mar | Apr | May | Jun | Jul | Aug | Sep | Oct | Nov | Dec |
|---|---|---|---|---|---|---|---|---|---|---|---|---|
| 2005 | 153 | 151 | 87 | 98 | 82 | 133 | 105 | 133 | 67 | 91 | 78 | 80 |
| 2006 | 52 | 45 | 103 | 266 | 342 | 543 | 644 | 537 | 414 | 389 | 341 | 400 |
| 2007 | 247 | 429 | 282 | 416 | 365 | 436 | 492 | 450 | 392 | 339 | 299 | 311 |
| 2008 | 374 | 422 | 457 | 495 | 480 | 477 | 432 | 557 | 417 | 301 | 325 | 335 |
| 2009 | 433 | 525 | 437 | 571 | 547 | 508 | 444 | 551 | 378 | 408 | 373 | 502 |
| - = No Data Reported; -- = Not Applicable; NA = Not Available; W = Withheld to avoid disclosure of individual company data. |
| Release Date: 6/28/2024 |
| Next Release Date: 7/31/2024 |