|
Download Data (XLS File) |
|
||||||||
|
||||||||
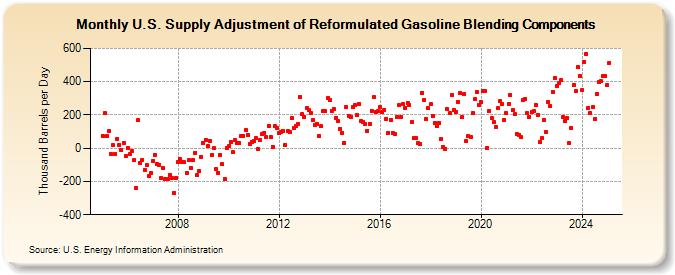
| U.S. Supply Adjustment of Reformulated Gasoline Blending Components (Thousand Barrels per Day) | ||||||||
| Year | Jan | Feb | Mar | Apr | May | Jun | Jul | Aug | Sep | Oct | Nov | Dec |
|---|---|---|---|---|---|---|---|---|---|---|---|---|
| 2005 | 76 | 209 | 72 | 104 | -34 | 20 | -35 | 57 | 22 | -13 | 34 | -46 |
| 2006 | 3 | -34 | -17 | -72 | -239 | 169 | -90 | -71 | -130 | -99 | -168 | -152 |
| 2007 | -77 | -38 | -96 | -99 | -178 | -122 | -185 | -187 | -159 | -182 | -267 | -178 |
| 2008 | -85 | -67 | -82 | -86 | -147 | -73 | -117 | -74 | -27 | -162 | -139 | -50 |
| 2009 | 32 | 50 | 14 | 44 | -39 | 2 | -126 | -148 | -39 | -98 | -186 | 1 |
| 2010 | 12 | 36 | -25 | 47 | 34 | 31 | 75 | 75 | 109 | 80 | 27 | 40 |
| 2011 | 43 | 61 | -2 | 48 | 86 | 93 | 66 | 136 | 70 | 9 | 131 | 121 |
| 2012 | 89 | 99 | 101 | 20 | 101 | 96 | 180 | 124 | 131 | 146 | 310 | 205 |
| 2013 | 190 | 243 | 229 | 213 | 168 | 138 | 147 | 76 | 131 | 222 | 221 | 301 |
| 2014 | 287 | 224 | 234 | 183 | 162 | 117 | 94 | 34 | 248 | 194 | 188 | 246 |
| 2015 | 259 | 197 | 266 | 161 | 159 | 145 | 106 | 147 | 226 | 305 | 217 | 222 |
| 2016 | 245 | 216 | 232 | 178 | 94 | 171 | 94 | 87 | 190 | 257 | 187 | 264 |
| 2017 | 244 | 273 | 260 | 160 | 61 | 62 | 29 | 25 | 334 | 291 | 174 | 240 |
| 2018 | 263 | 192 | 153 | 131 | 152 | 54 | 6 | -2 | 234 | 210 | 321 | 230 |
| 2019 | 218 | 280 | 334 | 185 | 327 | 41 | 74 | 65 | 210 | 294 | 340 | 262 |
| 2020 | 278 | 346 | 341 | 0 | 225 | 181 | 156 | 127 | 239 | 282 | 266 | 172 |
| 2021 | 211 | 266 | 319 | 230 | 203 | 88 | 80 | 65 | 289 | 295 | 209 | 187 |
| 2022 | 215 | 221 | 262 | 200 | 35 | 62 | 172 | 99 | 280 | 253 | 339 | 423 |
| 2023 | 443 | 405 | 391 | 186 | 166 | 186 | 52 | 90 | 386 | 339 | 500 | 454 |
| 2024 | 351 | |||||||||||
| - = No Data Reported; -- = Not Applicable; NA = Not Available; W = Withheld to avoid disclosure of individual company data. |
| Release Date: 3/29/2024 |
| Next Release Date: 4/30/2024 |