|
Download Data (XLS File) |
|
||||||||
|
||||||||
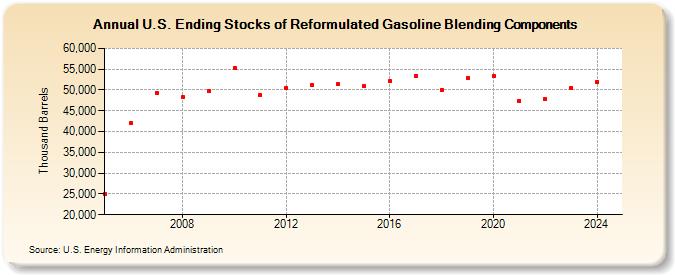
| U.S. Ending Stocks of Reformulated Gasoline Blending Components (Thousand Barrels) | ||||||||
| Decade | Year-0 | Year-1 | Year-2 | Year-3 | Year-4 | Year-5 | Year-6 | Year-7 | Year-8 | Year-9 |
|---|---|---|---|---|---|---|---|---|---|---|
| 2000's | 24,893 | 42,168 | 49,388 | 48,302 | 49,782 | |||||
| 2010's | 55,291 | 48,762 | 50,452 | 51,216 | 51,332 | 50,862 | 52,148 | 53,447 | 50,101 | 52,966 |
| 2020's | 53,444 | 47,357 | 47,772 | 51,297 |
| - = No Data Reported; -- = Not Applicable; NA = Not Available; W = Withheld to avoid disclosure of individual company data. |
| Release Date: 3/29/2024 |
| Next Release Date: 8/30/2024 |