|
Download Data (XLS File) |
|
||||||||
|
||||||||
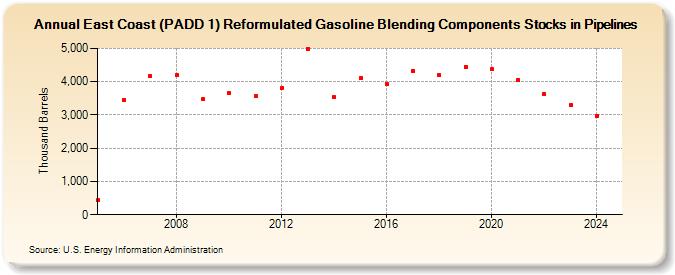
| East Coast (PADD 1) Reformulated Gasoline Blending Components Stocks in Pipelines (Thousand Barrels) | ||||||||
| Decade | Year-0 | Year-1 | Year-2 | Year-3 | Year-4 | Year-5 | Year-6 | Year-7 | Year-8 | Year-9 |
|---|---|---|---|---|---|---|---|---|---|---|
| 2000's | 438 | 3,460 | 4,158 | 4,195 | 3,466 | |||||
| 2010's | 3,646 | 3,559 | 3,798 | 4,990 | 3,538 | 4,109 | 3,943 | 4,328 | 4,186 | 4,455 |
| 2020's | 4,368 | 4,052 | 3,625 | 3,291 |
| - = No Data Reported; -- = Not Applicable; NA = Not Available; W = Withheld to avoid disclosure of individual company data. |
| Release Date: 3/29/2024 |
| Next Release Date: 8/30/2024 |