|
Download Data (XLS File) |
|
||||||||
|
||||||||
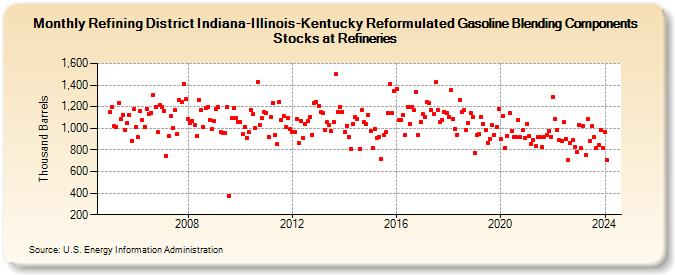
| Refining District Indiana-Illinois-Kentucky Reformulated Gasoline Blending Components Stocks at Refineries (Thousand Barrels) | ||||||||
| Year | Jan | Feb | Mar | Apr | May | Jun | Jul | Aug | Sep | Oct | Nov | Dec |
|---|---|---|---|---|---|---|---|---|---|---|---|---|
| 2005 | 1,152 | 1,196 | 1,017 | 1,014 | 1,237 | 1,083 | 1,127 | 986 | 1,049 | 1,125 | 886 | 1,174 |
| 2006 | 1,009 | 919 | 1,157 | 1,076 | 1,016 | 1,175 | 1,136 | 1,143 | 1,312 | 1,197 | 966 | 1,215 |
| 2007 | 1,198 | 1,162 | 748 | 926 | 1,111 | 1,007 | 1,168 | 951 | 1,259 | 1,239 | 1,411 | 1,267 |
| 2008 | 1,085 | 1,050 | 1,071 | 1,026 | 926 | 1,265 | 1,173 | 1,011 | 1,186 | 1,194 | 1,080 | 994 |
| 2009 | 1,064 | 1,183 | 1,194 | 963 | 956 | 959 | 1,200 | 376 | 1,095 | 1,186 | 1,096 | 1,057 |
| 2010 | 1,056 | 945 | 1,013 | 911 | 963 | 1,166 | 1,132 | 1,001 | 1,431 | 1,028 | 1,094 | 1,152 |
| 2011 | 1,143 | 924 | 1,103 | 1,238 | 937 | 854 | 1,247 | 1,078 | 1,113 | 1,009 | 1,099 | 991 |
| 2012 | 970 | 963 | 1,090 | 866 | 1,071 | 913 | 1,044 | 1,064 | 1,101 | 941 | 1,234 | 1,243 |
| 2013 | 1,211 | 1,150 | 1,139 | 981 | 1,055 | 1,029 | 974 | 1,062 | 1,499 | 1,151 | 1,200 | 1,151 |
| 2014 | 970 | 1,024 | 917 | 811 | 1,041 | 1,102 | 1,087 | 812 | 1,168 | 1,054 | 1,042 | 1,123 |
| 2015 | 978 | 820 | 995 | 911 | 923 | 718 | 936 | 964 | 1,141 | 1,409 | 1,137 | 1,345 |
| 2016 | 1,367 | 1,079 | 1,080 | 1,121 | 936 | 1,200 | 1,044 | 1,199 | 1,166 | 1,332 | 934 | 1,062 |
| 2017 | 1,131 | 1,101 | 1,242 | 1,237 | 1,166 | 1,131 | 1,428 | 1,165 | 1,059 | 1,080 | 1,155 | 1,141 |
| 2018 | 1,101 | 1,355 | 1,082 | 993 | 938 | 1,260 | 1,151 | 1,169 | 986 | 1,046 | 1,141 | 1,102 |
| 2019 | 772 | 937 | 945 | 1,105 | 1,040 | 981 | 867 | 902 | 1,030 | 942 | 1,013 | 1,178 |
| 2020 | 897 | 1,118 | 821 | 929 | 1,138 | 974 | 922 | 917 | 1,079 | 918 | 980 | 913 |
| 2021 | 1,042 | 927 | 859 | 894 | 838 | 921 | 917 | 826 | 924 | 938 | 975 | 919 |
| 2022 | 1,293 | 1,082 | 988 | 891 | 882 | 1,057 | 904 | 710 | 863 | 888 | 825 | 777 |
| 2023 | 1,030 | 813 | 1,021 | 757 | 1,082 | 881 | 1,017 | 915 | 817 | 848 | 986 | 813 |
| 2024 | 963 | |||||||||||
| - = No Data Reported; -- = Not Applicable; NA = Not Available; W = Withheld to avoid disclosure of individual company data. |
| Release Date: 3/29/2024 |
| Next Release Date: 4/30/2024 |