|
Download Data (XLS File) |
|
||||||||
|
||||||||
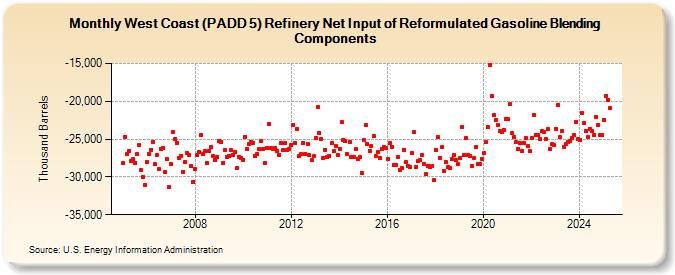
| West Coast (PADD 5) Refinery Net Input of Reformulated Gasoline Blending Components (Thousand Barrels) | ||||||||
| Year | Jan | Feb | Mar | Apr | May | Jun | Jul | Aug | Sep | Oct | Nov | Dec |
|---|---|---|---|---|---|---|---|---|---|---|---|---|
| 2005 | -28,117 | -24,662 | -27,016 | -26,535 | -27,901 | -27,655 | -28,105 | -26,905 | -25,786 | -29,028 | -30,002 | -31,098 |
| 2006 | -28,038 | -26,951 | -26,377 | -25,347 | -28,337 | -27,082 | -28,924 | -26,331 | -26,149 | -29,406 | -27,660 | -31,353 |
| 2007 | -28,281 | -24,124 | -24,979 | -25,489 | -27,457 | -27,202 | -29,299 | -27,974 | -26,807 | -27,109 | -28,596 | -30,608 |
| 2008 | -28,941 | -27,105 | -26,676 | -24,479 | -26,966 | -26,603 | -28,196 | -26,535 | -26,042 | -27,236 | -27,707 | -27,376 |
| 2009 | -25,236 | -25,335 | -28,095 | -26,466 | -27,368 | -27,175 | -26,465 | -27,051 | -26,704 | -28,834 | -27,315 | -27,494 |
| 2010 | -27,720 | -24,733 | -26,250 | -25,585 | -25,335 | -25,483 | -27,218 | -27,007 | -26,268 | -25,290 | -26,252 | -28,190 |
| 2011 | -26,232 | -22,971 | -26,177 | -26,350 | -26,207 | -26,523 | -27,049 | -25,496 | -26,444 | -25,474 | -26,439 | -26,341 |
| 2012 | -25,745 | -23,087 | -25,527 | -23,683 | -27,255 | -26,995 | -25,537 | -26,936 | -25,590 | -27,141 | -27,714 | -27,300 |
| 2013 | -24,836 | -20,748 | -24,218 | -25,045 | -27,437 | -26,415 | -27,380 | -27,170 | -25,501 | -26,606 | -25,882 | -27,091 |
| 2014 | -26,298 | -22,774 | -25,083 | -25,298 | -26,997 | -25,437 | -27,330 | -27,398 | -26,307 | -27,631 | -27,432 | -29,504 |
| 2015 | -25,139 | -23,159 | -25,631 | -26,508 | -25,888 | -24,612 | -27,291 | -26,731 | -27,526 | -26,361 | -26,010 | -26,212 |
| 2016 | -27,670 | -25,549 | -26,012 | -28,449 | -28,420 | -27,346 | -29,079 | -28,847 | -26,414 | -28,028 | -28,528 | -28,697 |
| 2017 | -26,899 | -24,121 | -28,736 | -27,934 | -27,816 | -27,155 | -28,340 | -29,650 | -28,545 | -28,687 | -28,543 | -30,378 |
| 2018 | -26,387 | -24,751 | -27,451 | -26,093 | -29,202 | -28,012 | -28,731 | -28,784 | -27,654 | -27,124 | -27,751 | -28,345 |
| 2019 | -27,514 | -23,415 | -27,141 | -24,848 | -27,053 | -27,174 | -28,588 | -27,547 | -25,993 | -28,299 | -28,275 | -27,602 |
| 2020 | -26,899 | -25,416 | -23,409 | -15,228 | -19,351 | -21,875 | -22,424 | -23,101 | -23,940 | -24,033 | -23,779 | -22,341 |
| 2021 | -22,396 | -20,331 | -24,247 | -24,775 | -25,384 | -26,281 | -25,479 | -26,524 | -25,469 | -24,878 | -25,975 | -26,626 |
| 2022 | -24,843 | -21,806 | -24,499 | -24,513 | -24,983 | -23,981 | -24,013 | -24,939 | -23,672 | -26,352 | -25,703 | -25,748 |
| 2023 | -23,620 | -20,450 | -24,718 | -23,915 | -26,038 | -25,693 | -25,432 | -25,248 | -24,815 | -24,420 | -22,730 | -24,986 |
| 2024 | -25,067 | |||||||||||
| - = No Data Reported; -- = Not Applicable; NA = Not Available; W = Withheld to avoid disclosure of individual company data. |
| Release Date: 3/29/2024 |
| Next Release Date: 4/30/2024 |