|
Download Data (XLS File) |
|
||||||||
|
||||||||
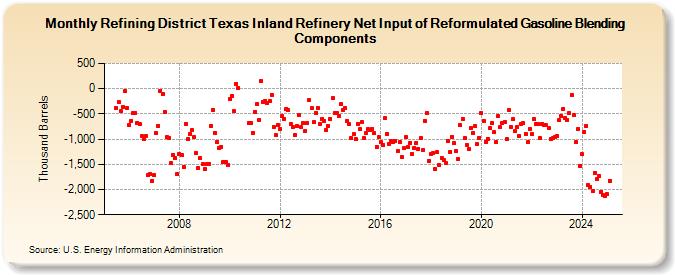
| Refining District Texas Inland Refinery Net Input of Reformulated Gasoline Blending Components (Thousand Barrels) | ||||||||
| Year | Jan | Feb | Mar | Apr | May | Jun | Jul | Aug | Sep | Oct | Nov | Dec |
|---|---|---|---|---|---|---|---|---|---|---|---|---|
| 2005 | -392 | -265 | -451 | -356 | -41 | -378 | ||||||
| 2006 | -727 | -634 | -491 | -476 | -673 | -701 | -941 | -1,007 | -937 | -1,717 | -1,690 | -1,825 |
| 2007 | -1,717 | -883 | -732 | -36 | -115 | -457 | -965 | -970 | -1,483 | -1,313 | -1,382 | -1,702 |
| 2008 | -1,294 | -1,323 | -1,545 | -699 | -994 | -900 | -823 | -967 | -1,273 | -1,571 | -1,378 | -1,495 |
| 2009 | -1,590 | -1,498 | -1,493 | -733 | -418 | -876 | -1,056 | -1,185 | -1,155 | -1,452 | -1,446 | -1,506 |
| 2010 | -209 | -138 | -449 | 94 | 20 | -687 | -679 | -873 | ||||
| 2011 | -454 | -304 | -619 | 153 | -273 | -248 | -287 | -237 | -120 | -760 | -923 | -718 |
| 2012 | -808 | -551 | -596 | -394 | -424 | -693 | -754 | -922 | -740 | -531 | -763 | -676 |
| 2013 | -833 | -675 | -231 | -390 | -662 | -481 | -378 | -704 | -606 | -638 | -818 | -740 |
| 2014 | -603 | -192 | -473 | -492 | -538 | -309 | -420 | -379 | -643 | -710 | -987 | -904 |
| 2015 | -994 | -693 | -808 | -661 | -980 | -880 | -805 | -817 | -795 | -885 | -1,156 | -966 |
| 2016 | -1,065 | -1,112 | -584 | -891 | -1,089 | -1,035 | -1,061 | -1,038 | -1,232 | -1,058 | -1,360 | -1,185 |
| 2017 | -968 | -1,156 | -1,076 | -1,287 | -1,169 | -1,070 | -1,187 | -987 | -1,220 | -634 | -485 | -1,427 |
| 2018 | -1,289 | -1,282 | -1,592 | -1,265 | -1,523 | -1,371 | -1,407 | -1,481 | -1,028 | -1,253 | -949 | -1,080 |
| 2019 | -1,244 | -1,401 | -730 | -593 | -983 | -1,112 | -1,196 | -770 | -872 | -746 | -1,103 | -969 |
| 2020 | -484 | -638 | -1,048 | -990 | -789 | -686 | -866 | -1,061 | -544 | -763 | -689 | -660 |
| 2021 | -994 | -432 | -760 | -608 | -849 | -762 | -933 | -710 | -690 | -894 | -1,065 | -796 |
| 2022 | -899 | -607 | -702 | -699 | -988 | -695 | -717 | -727 | -775 | -997 | -980 | -954 |
| 2023 | -937 | -630 | -534 | -401 | -574 | -621 | -485 | -127 | -524 | -1,067 | -800 | -1,531 |
| 2024 | -1,301 | |||||||||||
| - = No Data Reported; -- = Not Applicable; NA = Not Available; W = Withheld to avoid disclosure of individual company data. |
| Release Date: 3/29/2024 |
| Next Release Date: 4/30/2024 |