|
Download Data (XLS File) |
|
||||||||
|
||||||||
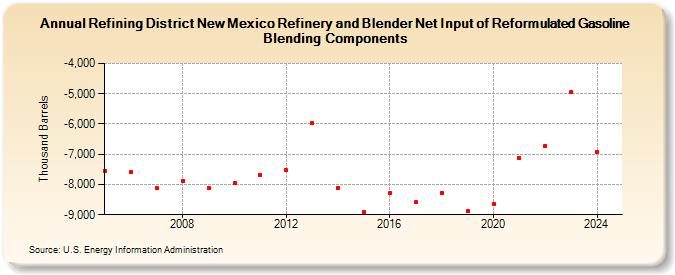
| Refining District New Mexico Refinery and Blender Net Input of Reformulated Gasoline Blending Components (Thousand Barrels) | ||||||||
| Decade | Year-0 | Year-1 | Year-2 | Year-3 | Year-4 | Year-5 | Year-6 | Year-7 | Year-8 | Year-9 |
|---|---|---|---|---|---|---|---|---|---|---|
| 2000's | -7,557 | -7,585 | -8,114 | -7,877 | -8,115 | |||||
| 2010's | -7,966 | -7,673 | -7,533 | -5,983 | -8,119 | -8,925 | -8,296 | -8,589 | -8,267 | -8,885 |
| 2020's | -8,644 | -7,115 | -6,726 | -4,935 |
| - = No Data Reported; -- = Not Applicable; NA = Not Available; W = Withheld to avoid disclosure of individual company data. |
| Release Date: 8/30/2024 |
| Next Release Date: 8/29/2025 |