|
Download Data (XLS File) |
|
||||||||
|
||||||||
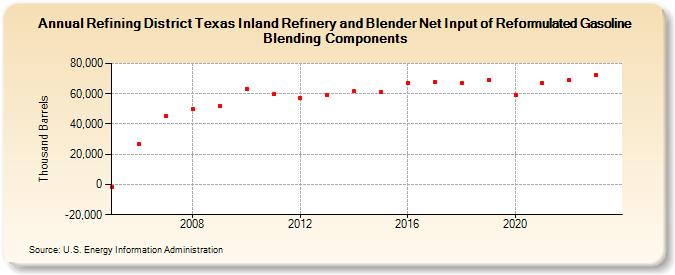
| Refining District Texas Inland Refinery and Blender Net Input of Reformulated Gasoline Blending Components (Thousand Barrels) | ||||||||
| Decade | Year-0 | Year-1 | Year-2 | Year-3 | Year-4 | Year-5 | Year-6 | Year-7 | Year-8 | Year-9 |
|---|---|---|---|---|---|---|---|---|---|---|
| 2000's | -1,883 | 26,433 | 45,388 | 49,711 | 51,831 | |||||
| 2010's | 63,342 | 59,597 | 57,399 | 59,053 | 61,564 | 61,034 | 66,942 | 67,784 | 67,013 | 69,298 |
| 2020's | 59,323 | 67,233 | 68,795 | 72,643 |
| - = No Data Reported; -- = Not Applicable; NA = Not Available; W = Withheld to avoid disclosure of individual company data. |
| Release Date: 8/30/2024 |
| Next Release Date: 8/29/2025 |