|
Download Data (XLS File) |
|
||||||||
|
||||||||
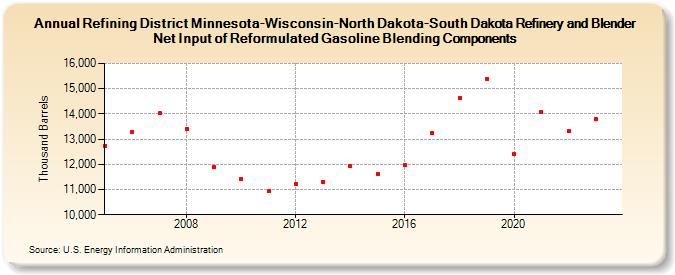
| Refining District Minnesota-Wisconsin-North Dakota-South Dakota Refinery and Blender Net Input of Reformulated Gasoline Blending Components (Thousand Barrels) | ||||||||
| Decade | Year-0 | Year-1 | Year-2 | Year-3 | Year-4 | Year-5 | Year-6 | Year-7 | Year-8 | Year-9 |
|---|---|---|---|---|---|---|---|---|---|---|
| 2000's | 12,738 | 13,271 | 14,025 | 13,414 | 11,875 | |||||
| 2010's | 11,417 | 10,929 | 11,219 | 11,291 | 11,916 | 11,632 | 11,959 | 13,242 | 14,633 | 15,402 |
| 2020's | 12,401 | 14,080 | 13,302 | 13,807 |
| - = No Data Reported; -- = Not Applicable; NA = Not Available; W = Withheld to avoid disclosure of individual company data. |
| Release Date: 3/29/2024 |
| Next Release Date: 8/30/2024 |