|
Download Data (XLS File) |
|
||||||||
|
||||||||
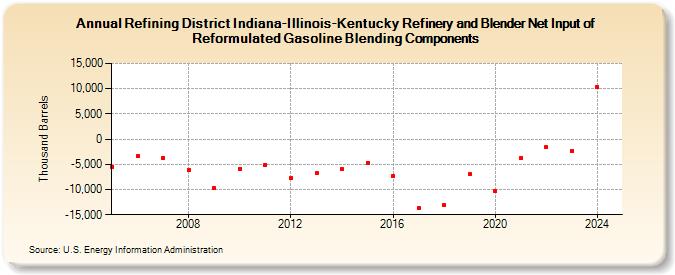
| Refining District Indiana-Illinois-Kentucky Refinery and Blender Net Input of Reformulated Gasoline Blending Components (Thousand Barrels) | ||||||||
| Decade | Year-0 | Year-1 | Year-2 | Year-3 | Year-4 | Year-5 | Year-6 | Year-7 | Year-8 | Year-9 |
|---|---|---|---|---|---|---|---|---|---|---|
| 2000's | -5,507 | -3,355 | -3,705 | -6,043 | -9,732 | |||||
| 2010's | -5,868 | -5,083 | -7,749 | -6,800 | -5,914 | -4,652 | -7,295 | -13,735 | -13,090 | -6,979 |
| 2020's | -10,385 | -3,713 | -1,633 | -2,286 |
| - = No Data Reported; -- = Not Applicable; NA = Not Available; W = Withheld to avoid disclosure of individual company data. |
| Release Date: 6/28/2024 |
| Next Release Date: 8/30/2024 |