|
Download Data (XLS File) |
|
||||||||
|
||||||||
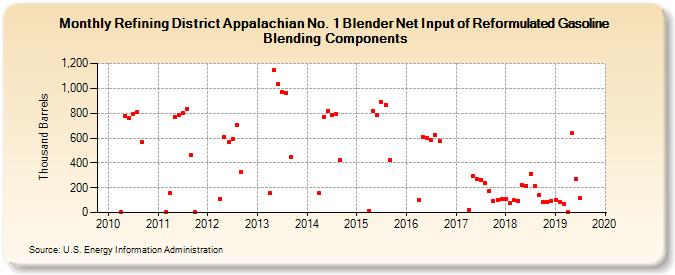
| Refining District Appalachian No. 1 Blender Net Input of Reformulated Gasoline Blending Components (Thousand Barrels) | ||||||||
| Year | Jan | Feb | Mar | Apr | May | Jun | Jul | Aug | Sep | Oct | Nov | Dec |
|---|---|---|---|---|---|---|---|---|---|---|---|---|
| 2010 | 5 | 778 | 764 | 794 | 808 | 568 | ||||||
| 2011 | 7 | 154 | 769 | 786 | 798 | 834 | 460 | 1 | ||||
| 2012 | 112 | 608 | 566 | 590 | 708 | 326 | ||||||
| 2013 | 161 | 1,148 | 1,032 | 967 | 964 | 445 | ||||||
| 2014 | 154 | 769 | 817 | 785 | 796 | 420 | ||||||
| 2015 | 12 | 818 | 782 | 887 | 867 | 420 | ||||||
| 2016 | 105 | 611 | 600 | 582 | 622 | 574 | ||||||
| 2017 | 20 | 295 | 270 | 266 | 237 | 175 | 94 | 101 | 107 | |||
| 2018 | 108 | 75 | 98 | 96 | 225 | 217 | 313 | 216 | 138 | 81 | 87 | 97 |
| 2019 | 103 | 81 | 72 | 1 | 637 | 267 | 121 | |||||
| - = No Data Reported; -- = Not Applicable; NA = Not Available; W = Withheld to avoid disclosure of individual company data. |
| Release Date: 8/30/2024 |
| Next Release Date: 9/30/2024 |