|
Download Data (XLS File) |
|
||||||||
|
||||||||
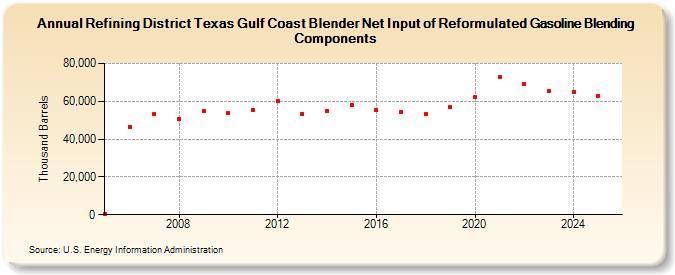
| Refining District Texas Gulf Coast Blender Net Input of Reformulated Gasoline Blending Components (Thousand Barrels) | ||||||||
| Decade | Year-0 | Year-1 | Year-2 | Year-3 | Year-4 | Year-5 | Year-6 | Year-7 | Year-8 | Year-9 |
|---|---|---|---|---|---|---|---|---|---|---|
| 2000's | 534 | 46,478 | 53,471 | 50,810 | 54,787 | |||||
| 2010's | 53,859 | 55,467 | 60,281 | 53,499 | 54,798 | 58,107 | 55,484 | 54,424 | 53,352 | 56,889 |
| 2020's | 62,016 | 72,675 | 68,992 | 65,201 |
| - = No Data Reported; -- = Not Applicable; NA = Not Available; W = Withheld to avoid disclosure of individual company data. |
| Release Date: 6/28/2024 |
| Next Release Date: 8/30/2024 |