|
Download Data (XLS File) |
|
||||||||
|
||||||||
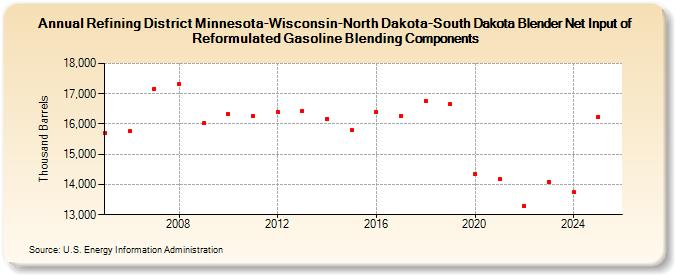
| Refining District Minnesota-Wisconsin-North Dakota-South Dakota Blender Net Input of Reformulated Gasoline Blending Components (Thousand Barrels) | ||||||||
| Decade | Year-0 | Year-1 | Year-2 | Year-3 | Year-4 | Year-5 | Year-6 | Year-7 | Year-8 | Year-9 |
|---|---|---|---|---|---|---|---|---|---|---|
| 2000's | 15,702 | 15,766 | 17,171 | 17,313 | 16,017 | |||||
| 2010's | 16,323 | 16,266 | 16,407 | 16,426 | 16,174 | 15,805 | 16,402 | 16,262 | 16,756 | 16,651 |
| 2020's | 14,341 | 14,180 | 13,302 | 14,092 |
| - = No Data Reported; -- = Not Applicable; NA = Not Available; W = Withheld to avoid disclosure of individual company data. |
| Release Date: 3/29/2024 |
| Next Release Date: 8/30/2024 |